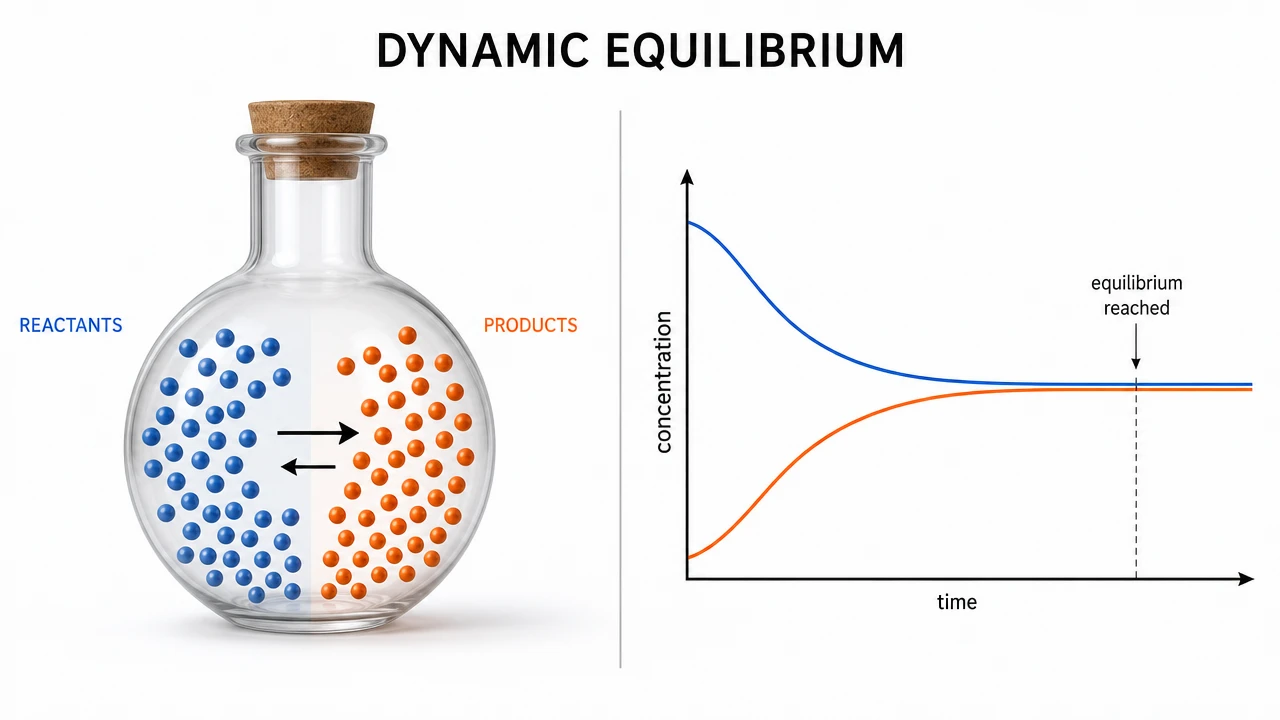
Dynamic Equilibrium — Rate-Time Graph

Part of Equilibrium (HT) · Section 2 of 14

DiagramUnit: Rates of ReactionGCSE

This diagram covers Dynamic Equilibrium — Rate-Time Graph within Equilibrium (HT) for GCSE Chemistry. Revise Equilibrium (HT) in Rates of Reaction for GCSE Chemistry with 23 exam-style questions and 18 flashcards. This is a high-frequency topic, so it is worth revising until the explanation feels precise and repeatable. It is section 2 of 14 in this topic. Focus on the labels, the relationships between parts, and the explanation that turns the diagram into an exam-ready answer.

📐 Dynamic Equilibrium — Rate-Time Graph

Graph showing forward reaction rate decreasing and reverse reaction rate increasing over time until they meet at equilibrium where both rates are equal

Figure 1: At equilibrium, the forward and backward reaction rates are equal. Concentrations remain constant but both reactions still occur.

Practice questions for Equilibrium (HT)

At dynamic equilibrium, which of the following is true?

  • A. The rate of the forward reaction equals the rate of the reverse reaction
  • B. The concentrations of reactants and products are always equal
  • C. The forward reaction stops and only the reverse reaction continues
  • D. All chemical reactions have stopped
1 markfoundation

Explain the effect of increasing temperature on the position of an equilibrium where the forward reaction is exothermic.

2 marksstandard

Quick recall flashcards

What conditions are needed for equilibrium?
A closed system (nothing can escape) and a reversible reaction
What does 'dynamic equilibrium' mean?
Forward and backward reactions happen at the same rate, so concentrations stay constant

23 questions on Equilibrium (HT) — practise free

Instant marking, adaptive difficulty and spaced-repetition flashcards — all aligned to your exam board.

Start revising free →