AQA GCSE Geography Paper 1Living with the Physical Environment: every question, answered
We analysed every Paper 1 sitting we could obtain the real question paper and mark scheme for since 2020, including the actual questions students saw and the mark schemes examiners used. This paper always covers Section A (The challenge of natural hazards: tropical storms, tectonic hazards and climate change), Section B (The living world: ecosystems, tropical rainforests and hot deserts or cold environments) and Section C (Physical landscapes in the UK, where you answer two of Coasts, Rivers or Glacial). Below is what each recurring question type has asked across the sittings we have, with a complete worked answer written to the mark scheme for each one, every paragraph explained.
Questions © AQA, quoted for analysis. Source materials described in our own words, not reproduced. Mark scheme content translated into plain English, not copied. PrepWise is independent and not endorsed by AQA.
The paper is a template
Same 14 question types, every sitting“Every sitting we have full papers for ends Section A with a 9 mark level-marked essay, always with 3 SPaG marks on top, but the exact topic alternates between managing or explaining climate change and explaining or evaluating tectonic hazards.”
This closing 9 mark plus SPaG question appears in all 4 sittings, always as the very last part of Question 1, but June 2020 and June 2021 asked about climate change (mitigation and adaptation, then human causation) while June 2022 and June 2023 asked about tectonic hazards (effects and wealth, then plate margin processes).
1×asked“'Managing climate change involves both reducing causes (mitigation) and responding to change (adaptation).' Do you agree? Explain your answer. Use Figure 6 and your own understanding.”
“'Managing climate change involves both reducing causes (mitigation) and responding to change (adaptation).' Do you agree? Explain your answer. Use Figure 6 and your own understanding.”
What it’s really asking
Judge whether tackling climate change really needs both cutting the causes AND coping with the effects already locked in, using the carbon capture photograph plus real named schemes for both strands.
What the sources actually showed — June 2020
Photographs showing strategies used to manage climate change, including a carbon capture facility as an example of mitigation (reducing the causes of climate change) and further images illustrating adaptation strategies such as farming adjustments, which respond to effects already underway rather than reducing causes.
The full worked answer — June 2020
Mitigation strategies like the carbon capture plant in Figure 6 tackle climate change at its source. Carbon capture and storage technology traps carbon dioxide from power stations and industrial plants before it reaches the atmosphere, converts it to liquid form, and injects it into sedimentary rock, and the technology can now capture up to around 90% of the CO2 that would otherwise be released. Planting trees works the same way over a longer timescale, since growing forests act as carbon sinks that absorb CO2 through photosynthesis.
But mitigation alone cannot undo warming that has already started, which is why adaptation matters just as much. Figure 6 also shows farming adapting to a changing climate, since some crops may no longer suit a warmer or drier area while drought-resistant plants and crops like oranges and grapes become viable where rainfall is lower, while coastal communities at risk from rising sea levels are building sea defences or raising houses on stilts. Because some warming is now unavoidable even if emissions stopped tomorrow, adaptation strategies like these are just as necessary as mitigation, so I agree that managing climate change genuinely needs both.
Could you have written this? Every fact in this answer is drilled in our quizzes — the writing is the easy part once the evidence is automatic.
Practise the closing 9 mark judgementWhat the mark scheme rewarded
- A developed explanation of at least one mitigation strategy and one adaptation strategy, using Figure 6, followed by a genuine supported judgement on whether both are needed
- Carbon capture and storage can trap up to around 90% of CO2 from power stations before it reaches the atmosphere
- Drought-resistant crops and coastal sea defences are real adaptation strategies already in use
Traps examiners saw
- Describing mitigation and adaptation as a list without ever using Figure 6
- Never reaching an explicit judgement on whether both are genuinely needed
Full-mark self-check 0 of 3
1×asked“To what extent is climate change the result of human actions? Use Figure 4 and your own understanding.”
“To what extent is climate change the result of human actions? Use Figure 4 and your own understanding.”
What it’s really asking
Weigh up how much of today's climate change is really down to human activity like burning fossil fuels, against natural causes like orbital changes and volcanic activity, and reach a supported verdict.
What the sources actually showed — June 2021
Photographs showing some causes of climate change, including a human cause (fossil fuel use, inferred from the figure) and a natural cause (volcanic activity, also inferable from the figure), used as a stimulus for a judgement on how far climate change results from human action.
The full worked answer — June 2021
The strongest evidence for a human cause is the burning of fossil fuels shown by Figure 4, since fossil fuels account for over half of all global greenhouse gas emissions once they are used for transport, heating, and generating electricity. Deforestation adds to this, because cutting down trees removes a carbon sink that would otherwise absorb CO2, and burning the cleared vegetation releases even more CO2 directly into the atmosphere, so this is a second, distinct human driver working alongside fossil fuel use rather than the same cause repeated.
However, natural factors have driven climate change long before industrialisation. Figure 4 also points to volcanic activity, which releases ash that can reflect the Sun's rays and cool the planet in the short term, but over time releases greenhouse gases like carbon dioxide that trap heat and warm it instead. Longer natural cycles add to this picture too, since the Earth's orbit shifts from a circular to an oval shape roughly every 100,000 years in the Milankovitch cycle, changing how much solar energy the planet receives, and solar output itself varies over an 11 year sunspot cycle. Since the start of the industrial era around 1750, though, the scale and speed of warming vastly exceeds what these natural causes alone can explain, so on balance I judge that climate change today is very largely the result of human actions, even though natural processes still play a background role.
Could you have written this? Every fact in this answer is drilled in our quizzes — the writing is the easy part once the evidence is automatic.
Practise the closing 9 mark judgementWhat the mark scheme rewarded
- A developed account of at least one human cause using Figure 4, weighed explicitly against a natural cause, ending in a supported extent judgement
- Fossil fuels account for over half of global greenhouse gas emissions
- Milankovitch cycles shift the Earth's orbit on a roughly 100,000 year cycle and predate any human influence
Traps examiners saw
- Listing only human causes with no natural-cause counterweight, which caps the answer below Level 3
- Never using Figure 4 at all, even by inference
Full-mark self-check 0 of 3
1×asked“To what extent do the effects of a tectonic hazard vary between areas of contrasting wealth? Use one or more named examples in your answer.”
“To what extent do the effects of a tectonic hazard vary between areas of contrasting wealth? Use one or more named examples in your answer.”
What it’s really asking
Compare how the same type of tectonic hazard plays out differently in a wealthier country versus a poorer one, using real named earthquakes with real casualty and homelessness figures, then judge how much wealth really explains the difference.
The full worked answer — June 2022
The 2009 L'Aquila earthquake in Italy, a wealthier HIC, measured magnitude 6.3 and killed around 300 people while making over 60,000 homeless. In stark contrast, the 2015 Gorkha earthquake in Nepal, a much poorer country, measured a far more powerful magnitude 7.8 and killed over 8,000 people, making more than a million homeless. Both countries declared a state of emergency and received international assistance, but Nepal's poorer infrastructure and weaker building regulations meant far more structures collapsed even accounting for the stronger shaking.
However, wealth is not the only factor at work here, since the Nepal earthquake was roughly 31 times more powerful than the one in Italy, based on the way the magnitude scale works, so raw earthquake strength alone could explain much of the death toll gap regardless of income. I therefore judge that wealth does strongly affect how well a country prepares for, responds to, and recovers from a tectonic hazard, but the effects of any single earthquake also depend heavily on its magnitude and depth, so wealth only partly explains the contrast between these two events.
Could you have written this? Every fact in this answer is drilled in our quizzes — the writing is the easy part once the evidence is automatic.
Practise the closing 9 mark judgementWhat the mark scheme rewarded
- Detailed knowledge of the effects of a tectonic hazard in at least one named example, ideally contrasting wealth levels, with a coherent evaluation of how far wealth explains the difference
- L'Aquila 2009 (Italy): magnitude 6.3, around 300 deaths, over 60,000 homeless
- Gorkha 2015 (Nepal): magnitude 7.8, over 8,000 deaths, more than 1 million homeless
Traps examiners saw
- Describing only one country's earthquake with no contrast at all, which limits the answer to Level 2
- Assuming wealth is the only explanation and ignoring magnitude or depth as a rival factor
Full-mark self-check 0 of 3
1×asked“Suggest how the processes taking place at different types of plate margin can lead to earthquakes and volcanic activity. Use Figure 6 and your own understanding.”
“Suggest how the processes taking place at different types of plate margin can lead to earthquakes and volcanic activity. Use Figure 6 and your own understanding.”
What it’s really asking
Explain, for at least two of the three plate margin types shown in the diagrams, exactly what physical process at that margin produces earthquakes and/or volcanoes.
What the sources actually showed — June 2023
Three labelled diagrams showing a constructive margin, a destructive margin, and a conservative margin.
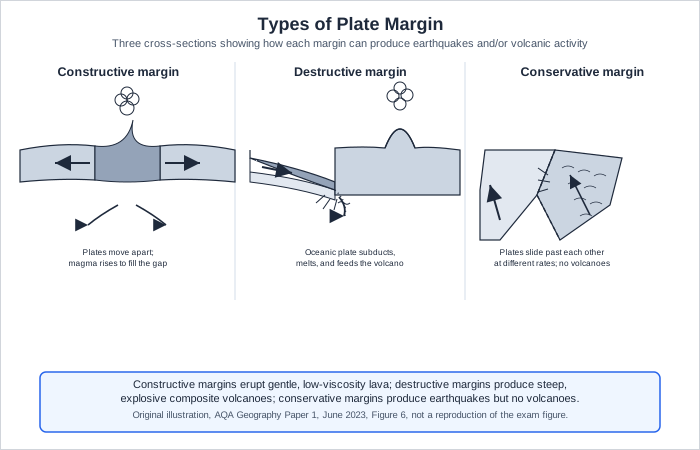
The full worked answer — June 2023
At a destructive margin, shown in Figure 6, two plates move towards each other and the denser oceanic plate is subducted beneath the lighter continental plate, sinking into the mantle where it melts. This hot magma rises through the overlying crust and becomes increasingly viscous as it nears the surface, so when it does erupt it forms steep-sided composite volcanoes with violent eruptions, ash falls, and pyroclastic flows. Earthquakes also occur here because as the plates converge, pressure builds up until the rock fractures, with some quakes shallow near the surface and others much deeper within the subduction zone itself.
At a constructive margin, by contrast, two plates move apart and magma rises to fill the gap, cooling to form new crust. Because this magma is much less viscous, it produces gentler, wide, basic lava cones rather than explosive volcanoes. Earthquakes at constructive margins are usually low in magnitude, caused by faulting as the plates pull apart, and tend to be shallow. Naming Iceland as a real example of a constructive margin, where both gentle volcanic activity and minor earthquakes are well documented, shows the process is not just theoretical.
Could you have written this? Every fact in this answer is drilled in our quizzes — the writing is the easy part once the evidence is automatic.
Practise the closing 9 mark judgementWhat the mark scheme rewarded
- A detailed explanation of the processes at two or more plate margin types, covering both earthquakes and volcanic activity, with credit for a named real example
- Destructive margins: subduction, melting, viscous magma, composite volcanoes, quakes at varying depths
- Constructive margins: plates diverge, gentle basic lava cones, shallow low-magnitude quakes, e.g. Iceland
Traps examiners saw
- Explaining only one type of plate margin, which caps the answer at Level 2
- Naming a margin type without explaining the actual physical process that causes the hazard
Full-mark self-check 0 of 3
The method for every Q01.12 / Q01.11 / Q01.10 / Q01.11 — same every sittingMark bands, steps, timing
What this question type rewards
The topic changes by sitting — the mark scheme never does. Learn this once, then open your question above for that sitting’s sources and a full worked answer.
- Detailed, accurate knowledge of the named topic, not just a general description
- Explicit application to the given figure, direct or clearly inferred
- A genuine, supported judgement or evaluation where the command word asks for one
- Accurate spelling, punctuation, grammar and a wide range of specialist terminology across the whole answer, since this earns the separate SPaG marks
The steps
- Identify the real command word (explain, discuss, to what extent, do you agree) and make sure the final paragraph directly answers it
- Use the figure explicitly, even a one line reference is enough to avoid being capped
- Bring at least one real named example or statistic for each side of the argument
- Write in full sentences with accurate specialist terminology throughout, since SPaG is marked separately across the whole answer
- Leave time to check spelling of key terms (mitigation, adaptation, subduction, tectonic) since these count towards the specialist-terminology strand of SPaG
At which type of plate margin do two plates move towards each other, causing one to be forced beneath the other?
This is the single highest-value question on the whole paper, worth 9 marks plus 3 SPaG marks every single sitting. Practise both a climate change judgement and a tectonic hazards judgement so you are ready whichever one comes up.
Practise the closing 9 mark judgement“Every sitting we have full papers for includes a 6 mark, three-level judgement question partway through Section A, always instructing students to use the given figure and their own understanding.”
This 6 mark Section A question recurs in all 4 sittings, though the exact topic shifts between tropical storm severity, tectonic hazard advantages and disadvantages, UK extreme weather, and storm protection and prediction.
1×asked“Suggest why some tropical storms have severe primary and secondary effects. Use Figure 3 and your own understanding.”
“Suggest why some tropical storms have severe primary and secondary effects. Use Figure 3 and your own understanding.”
What it’s really asking
Explain what makes some tropical storms much more destructive than others, separating the direct primary effects from the knock-on secondary effects, using the real Cyclone Idai data given.
What the sources actually showed — June 2020
A factfile on Cyclone Idai's impact on Mozambique in 2019: wind speeds up to 200 km per hour, over 150 mm of rain in 24 hours, 1300 deaths, over 1 million people displaced, 90% of the city of Beira damaged or destroyed, a cholera outbreak affecting 5000 people, total damage of US$2.2 billion, alongside Mozambique's GNI of US$1153 per person per year and 80% of the population living on less than US$2 a day.
The full worked answer — June 2020
Cyclone Idai's primary effects were severe because of the storm's own power: wind speeds of up to 200 km per hour combined with over 150 mm of rain in 24 hours caused widespread building collapse and the 1300 deaths recorded, largely from flying debris and drowning as the storm surge created what the factfile calls 'inland oceans' across the low-lying land around Beira.
The secondary effects were made worse by Mozambique's low income, since a GNI of only US$1153 per person per year means little money is available for storm shelters, monitoring, or rapid recovery, and with 80% of the population living on less than US$2 a day, over a million displaced people had very little of their own resources to fall back on. This is exactly why the cholera outbreak affecting 5000 people followed the flooding, since damaged water and sanitation infrastructure could not be repaired quickly in such a poor country, showing that a storm's severity depends on the wealth of the area it hits as much as on its own wind speed and rainfall.
Could you have written this? Every fact in this answer is drilled in our quizzes — the writing is the easy part once the evidence is automatic.
Practise Section A judgement questionsWhat the mark scheme rewarded
- Thorough understanding of both primary and secondary effects, using Figure 3 directly, linking severity to both storm strength and the wealth of the country affected
- Cyclone Idai: winds up to 200 km/h, over 150 mm rain in 24 hours, 1300 deaths, 1 million+ displaced
- Mozambique GNI of US$1153 per person per year, 80% living on less than US$2 a day
Traps examiners saw
- Explaining only primary OR only secondary effects, which caps the answer at Level 2
- Ignoring the wealth data in Figure 3 and writing only about wind speed
Full-mark self-check 0 of 3
1×asked“Explain how living in areas that are at risk from a tectonic hazard(s) may have both advantages and disadvantages.”
“Explain how living in areas that are at risk from a tectonic hazard(s) may have both advantages and disadvantages.”
What it’s really asking
Give a balanced explanation covering both a genuine benefit AND a genuine drawback of living somewhere at risk from earthquakes or volcanoes.
The full worked answer — June 2021
One real advantage is that volcanic soils are extremely fertile once weathered, since nutrient-rich volcanic ash breaks down into rich farmland, which is why areas near Mount Vesuvius in Italy grow olives, vines and citrus fruit on the volcanic slopes despite the eruption risk. Geothermal energy is a second advantage in volcanic areas, and in Iceland this provides around 28% of the country's total energy, including heating pavements in the capital, Reykjavik, during winter.
The disadvantages can be severe, though: ground shaking in earthquake zones causes buildings, bridges and power lines to collapse, and gas and water mains to fracture, leading to immediate deaths from crushing and falling debris. Longer term, disease spreads from contaminated water supplies, and unemployment rises as damaged businesses cannot operate, so while volcanic soil and geothermal energy genuinely attract people to these areas, the same tectonic activity can devastate a community in seconds, which is why both sides of this question carry real weight.
Could you have written this? Every fact in this answer is drilled in our quizzes — the writing is the easy part once the evidence is automatic.
Practise Section A judgement questionsWhat the mark scheme rewarded
- Detailed knowledge of both an advantage and a disadvantage of living at risk from a tectonic hazard, developed in comparable depth
- Volcanic soils near Vesuvius support olive, vine and citrus farming
- Geothermal energy provides around 28% of Iceland's total energy
Traps examiners saw
- Writing only about advantages or only disadvantages, which caps the answer at Level 2
- Naming a hazard that is not actually tectonic, such as a flood, which limits the answer to Level 1
Full-mark self-check 0 of 2
1×asked“'UK weather is becoming more extreme.' Do you agree? Use Figure 4 and your own understanding.”
“'UK weather is becoming more extreme.' Do you agree? Use Figure 4 and your own understanding.”
What it’s really asking
Weigh up the real evidence for more extreme UK weather (using the moorland fire and flooding photographs) against the fact that UK weather naturally varies a lot year to year, and reach a supported view.
What the sources actually showed — June 2022
Two photographs: one showing moorland fires linked to higher summer temperatures and lower rainfall in some areas, and one showing flooding linked to higher rainfall and more storm events.
The full worked answer — June 2022
Figure 4 shows real evidence on both ends of the extreme weather scale: moorland fires caused by higher summer temperatures and lower rainfall, and flooding caused by higher rainfall and more storm events. Met Office data backs this up, showing the UK has warmed by around 1 degree C since 1980, a change linked to hotter summers and a greater chance of drought, while more winter rain has fallen in heavy events since the 1980s, increasing the frequency of river flooding such as the 2009 Cumbria floods and 2014 Somerset Levels floods.
However, UK weather is naturally very variable, and pointing to just a handful of recent extreme events like Storm Ciara or the Beast from the East is not on its own proof of a long-term trend, since many parts of the country are not experiencing significantly different weather patterns year to year. On balance, I agree that UK weather is becoming more extreme, because the Met Office's own long-term data, not just isolated headline events, shows real increases in both heavy winter rainfall and summer heat, but I recognise that a single wet winter or hot summer alone would not prove this on its own.
Could you have written this? Every fact in this answer is drilled in our quizzes — the writing is the easy part once the evidence is automatic.
Practise Section A judgement questionsWhat the mark scheme rewarded
- Thorough understanding of the evidence for extreme weather in the UK, using Figure 4, leading to a supported judgement that also considers natural variability
- UK has warmed by around 1 degree C since 1980, linked to hotter summers and drought risk
- More winter rain has fallen in heavy events since the 1980s, increasing flood frequency (e.g. Cumbria 2009, Somerset Levels 2014)
Traps examiners saw
- Describing the two photographs without linking them to any real UK weather trend or data
- Reaching a judgement with no supporting evidence at all
Full-mark self-check 0 of 3
1×asked“To what extent can protection and prediction strategies reduce the effects of tropical storms? Use Figure 5 and your own understanding.”
“To what extent can protection and prediction strategies reduce the effects of tropical storms? Use Figure 5 and your own understanding.”
What it’s really asking
Explain how BOTH prediction (forecasting the storm's path) AND protection (physically defending buildings and people) reduce harm from tropical storms, then judge how far these strategies really work.
What the sources actually showed — June 2023
A photograph of a raised cyclone shelter in Bangladesh, alongside a map showing the predicted and observed track of Cyclone Amphan in May 2020, including wind speed bands and the area most likely to be affected.
The full worked answer — June 2023
Prediction is shown in Figure 5 through the tracking of Cyclone Amphan, where satellite images and computer modelling produced a forecast track and a 'cone of uncertainty' covering the area most likely to be affected, allowing places like Odisha, well outside that cone, to carry on largely as normal without evacuating. Modern supercomputers can now give around five days' warning with a fairly accurate location, giving people real time to board up windows, stockpile supplies, and evacuate if needed.
Protection is shown by the raised cyclone shelter itself, elevated above ground level to keep people safe from flood water, with a reinforced structure able to withstand powerful winds and a flat roof that may allow helicopter access; shelters like these have been genuinely effective in cutting the cyclone death toll in Bangladesh. However, even the best forecasting cannot always predict a storm's exact strength or path in time, and poorer coastal communities may not have enough shelters for everyone, so I judge that protection and prediction together can greatly reduce, but never fully eliminate, the effects of a tropical storm.
Could you have written this? Every fact in this answer is drilled in our quizzes — the writing is the easy part once the evidence is automatic.
Practise Section A judgement questionsWhat the mark scheme rewarded
- Thorough understanding of both prediction and protection strategies, applied to Figure 5, with an evaluative judgement on how far they reduce the effects of tropical storms
- Cyclone Amphan's forecast 'cone of uncertainty' let unaffected areas like Odisha avoid unnecessary evacuation
- Raised, reinforced cyclone shelters in Bangladesh have measurably cut storm death tolls
Traps examiners saw
- Explaining only prediction or only protection, which caps the answer at Level 2
- Giving an unqualified 'yes it always works' without acknowledging any limitation
Full-mark self-check 0 of 3
The method for every Q01.5 / Q01.3 / Q01.8 / Q01.10 — same every sittingMark bands, steps, timing
What this question type rewards
The topic changes by sitting — the mark scheme never does. Learn this once, then open your question above for that sitting’s sources and a full worked answer.
- Applying knowledge and understanding to the figure, not just describing it
- Developing at least two distinct points rather than a long unlinked list
- Reaching a genuine judgement where the command word (do you agree, to what extent, assess) requires one
The steps
- Read the command word carefully: 'suggest', 'explain', 'do you agree' and 'to what extent' each expect a different final move
- Use the figure explicitly, quoting a real detail from it
- Develop two distinct points rather than listing many shallow ones
- If the command word asks for a judgement, write an explicit sentence that answers it
What is the minimum ocean surface temperature required for a tropical storm to form?
This 6 mark question always needs the figure used explicitly, not just background knowledge. Practise pulling a real number or detail from the source every time.
Practise Section A judgement questions“Every sitting we have full papers for includes a 4 mark, two-level short explanation partway through Question 1. Three of the four sittings focus on tectonic hazard processes, and June 2023 focuses on climate change effects on people instead.”
This 4 mark slot recurs in all 4 sittings, with June 2020, June 2021 and June 2022 all explaining tectonic hazard risk-reduction or plate margin processes, while June 2023 tested climate change effects on people at the same tariff and position in the paper.
1×asked“Explain how the risks of a tectonic hazard can be reduced.”
“Explain how the risks of a tectonic hazard can be reduced.”
What it’s really asking
Explain how and why a real strategy (monitoring, prediction, protection or planning) actually lowers the risk from an earthquake or volcano, not just name the strategy.
The full worked answer — June 2020
Protection reduces earthquake risk through better building design: rubber shock absorbers fitted into a building's foundations absorb the energy of Earth tremors, while steel frames are designed to sway during ground movement rather than snapping, and open assembly areas outside buildings give people somewhere safe to gather during an evacuation.
Planning also reduces risk, since regular earthquake drills in hospitals, schools and other public buildings mean people already know exactly what to do the moment shaking starts, which speeds up evacuation and cuts casualties. Monitoring using seismometers to record earth tremors around a volcano can give some warning before an eruption, even though the exact timing is very hard to predict, so combining planning with monitoring reduces both the immediate and the longer-term danger from a tectonic hazard.
Could you have written this? Every fact in this answer is drilled in our quizzes — the writing is the easy part once the evidence is automatic.
Practise tectonic process explanationsWhat the mark scheme rewarded
- A developed explanation of how one or more strategies (monitoring, prediction, protection, planning) genuinely reduce tectonic hazard risk, not just naming them
- Rubber shock absorbers and swaying steel frames in earthquake-resistant building design
- Regular earthquake or volcano drills in schools, hospitals and public buildings
Traps examiners saw
- Naming a strategy (e.g. 'better buildings') without explaining how it actually reduces risk
- Writing only about a non-tectonic hazard, which caps the answer at Level 1
Full-mark self-check 0 of 2
1×asked“Suggest why earthquakes and volcanic eruptions happen close to the plate margin at Y. Use Figure 2 and your own understanding.”
“Suggest why earthquakes and volcanic eruptions happen close to the plate margin at Y. Use Figure 2 and your own understanding.”
What it’s really asking
Explain the subduction process at the specific destructive margin shown at point Y on the map (the Nazca Plate sinking beneath the South American Plate), covering both why volcanoes and why earthquakes occur there.
What the sources actually showed — June 2021
A map of tectonic plates in North and South America, showing the Nazca Plate subducting beneath the South American Plate at point Y on the western coast of South America.
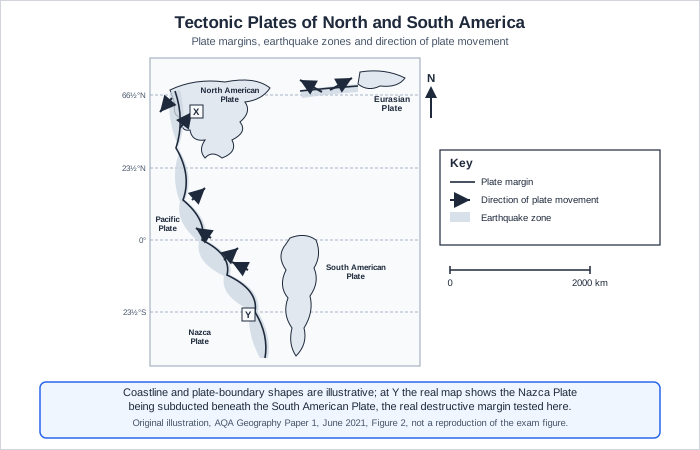
The full worked answer — June 2021
At point Y, Figure 2 shows the denser Nazca Plate being subducted beneath the lighter South American Plate. As the Nazca Plate sinks into the mantle it melts in the subduction zone, and the resulting magma rises up through the overlying crust, sometimes erupting at the surface to form volcanoes, which explains the volcanic activity recorded along this stretch of coast.
Earthquakes happen at the same margin because as the two plates converge, enormous pressure builds up in the rock until it eventually fractures, releasing energy as an earthquake; these can occur at shallow depths right where the plates meet, or much deeper within the subduction zone itself. Because both the volcanic activity and the earthquakes are driven by the same subduction process at Y, this margin experiences frequent tectonic hazards of both types.
Could you have written this? Every fact in this answer is drilled in our quizzes — the writing is the easy part once the evidence is automatic.
Practise tectonic process explanationsWhat the mark scheme rewarded
- A clear explanation of the subduction process at the destructive margin shown, covering both why volcanoes and why earthquakes occur there
- Nazca Plate subducts beneath the South American Plate, melting to feed volcanoes
- Pressure builds as plates converge until the rock fractures, causing earthquakes at varying depths
Traps examiners saw
- Explaining volcanoes but not earthquakes, or vice versa, which limits the answer to Level 1
- Describing a constructive or conservative margin process instead of the destructive one actually shown at Y
Full-mark self-check 0 of 2
1×asked“Explain why earthquakes and volcanic eruptions take place along destructive plate margins.”
“Explain why earthquakes and volcanic eruptions take place along destructive plate margins.”
What it’s really asking
Give the full mechanical explanation of subduction, melting and pressure build-up that produces both volcanoes and earthquakes specifically at a destructive margin.
The full worked answer — June 2022
Destructive margins occur where two plates move towards each other, and if an oceanic plate collides with a continental plate, the denser oceanic plate is subducted, sinking below the continental plate and down into the Earth's mantle. This causes part of the mantle to melt, and the resulting magma rises up through the overlying crust, eventually erupting at the surface to form volcanoes.
Earthquakes occur at the same margins because as the plates converge, pressure steadily builds up in the surrounding rock, and when this pressure is eventually released it causes the rock to fracture, generating an earthquake. Because destructive margins involve two plates constantly grinding and pushing against each other, this pressure builds up repeatedly, which is why both volcanic eruptions and earthquakes are common along the same destructive boundary.
Could you have written this? Every fact in this answer is drilled in our quizzes — the writing is the easy part once the evidence is automatic.
Practise tectonic process explanationsWhat the mark scheme rewarded
- An accurate explanation of subduction and melting causing volcanic activity, and pressure build-up and fracture causing earthquakes, both specific to destructive margins
- Denser oceanic plate subducts and melts, feeding magma that erupts as volcanoes
- Pressure from converging plates builds until the rock fractures, causing an earthquake
Traps examiners saw
- Describing processes at a constructive or conservative margin instead, which earns no credit
- Explaining only volcanoes or only earthquakes, which caps the answer at low Level 2
Full-mark self-check 0 of 2
1×asked“Suggest how climate change may have effects on people. Use Figure 2 and your own understanding.”
“Suggest how climate change may have effects on people. Use Figure 2 and your own understanding.”
What it’s really asking
Explain two distinct ways climate change harms people directly, using the real regional effects labelled on the world map (health problems, flood damage, lower crop yields, freshwater shortages, and so on).
What the sources actually showed — June 2023
A world map showing possible effects of climate change by region: freshwater shortages, lower crop yields, food shortages, wildfires, health problems, flood damage, coastal erosion, and species loss, alongside a note that a 2.5 degree C temperature rise could cut global GNI by up to 2% every year.
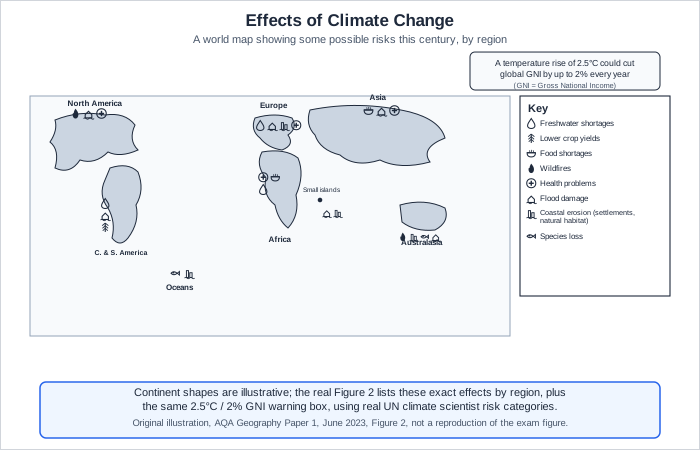
The full worked answer — June 2023
Lower crop yields, shown affecting Central and South America on Figure 2, will reduce food supplies and increase food insecurity, raising the risk of hunger and malnutrition in areas that are already less able to import food to make up the difference. This links directly to the freshwater shortages shown across Africa on the same map, since a shortage of clean water can also damage health and may even trigger conflict or refugee movements as people are forced to search for water elsewhere.
Coastal erosion, shown affecting small islands such as the Maldives, threatens to submerge low-lying land entirely as sea levels rise, potentially forcing the evacuation of whole island populations, while flood damage elsewhere destroys buildings and can force people to migrate, causing overcrowding wherever they resettle. With a temperature rise of 2.5 degrees C estimated to cut global GNI by up to 2% every year, the economic effects of these events on ordinary people's livelihoods, not just their homes, are a further way climate change reaches people directly.
Could you have written this? Every fact in this answer is drilled in our quizzes — the writing is the easy part once the evidence is automatic.
Practise tectonic process explanationsWhat the mark scheme rewarded
- A developed explanation of at least two distinct effects of climate change on people, using Figure 2's labelled regional effects rather than a bare list from the key
- Lower crop yields (Central and South America) raise the risk of hunger and malnutrition
- Coastal erosion threatens to submerge small islands such as the Maldives, forcing evacuation
Traps examiners saw
- Simply copying the exact wording from the key on Figure 2 without any development
- Writing about environmental effects with no link at all to people
Full-mark self-check 0 of 2
The method for every Q01.9 / Q01.6 / Q01.9 / Q01.4 — same every sittingMark bands, steps, timing
What this question type rewards
The topic changes by sitting — the mark scheme never does. Learn this once, then open your question above for that sitting’s sources and a full worked answer.
- Explaining the mechanism (how and why), not just naming a strategy or process
- Developing two distinct points rather than one point repeated in different words
- Using the figure directly where one is given
The steps
- Identify exactly which process or effect the question is asking about
- Explain the mechanism step by step (what happens, then why that causes the hazard or effect)
- Add a second, genuinely distinct point rather than restating the first one
- Reference the figure by name if one is given, even briefly
At which type of plate margin do two plates move towards each other, causing one to be forced beneath the other?
This 4 mark question rewards explaining the mechanism, not just naming it. Practise writing out subduction, pressure build-up, and eruption as a clear step-by-step chain.
Practise tectonic process explanations“Section A regularly tests a short numeracy skill, calculating a percentage, measuring a distance, reading a change, or finding a median directly from real hazard data, at a 1 or 2 mark tariff.”
A calculation or measurement question of this kind appears in every sitting we have full papers for, though the exact skill and tariff varies: a 2 mark percentage calculation in June 2020, a 2 mark distance measurement in June 2022, and two separate 1 mark questions (a graph-reading change, and a median) in June 2023.
1×asked“The total number of typhoons reaching Japan was 204. What percentage of the total number of typhoons occurred in August? Give your answer to the nearest whole percentage.”
“The total number of typhoons reaching Japan was 204. What percentage of the total number of typhoons occurred in August? Give your answer to the nearest whole percentage.”
What it’s really asking
Read the August value off the bar graph, then calculate it as a percentage of the given 204 total typhoons, rounding to the nearest whole percentage.
What the sources actually showed — June 2020
A bar graph showing the number of tropical storms (typhoons) reaching Japan in each month between 1851 and 2018, with August the tallest bar at 69, followed closely by September at 67.
The full worked answer — June 2020
Reading the graph, August shows around 70 typhoons out of the total of 204. Dividing 70 by 204 gives 0.343, which as a percentage is 34.3%, rounding to 34% to the nearest whole percentage.
Could you have written this? Every fact in this answer is drilled in our quizzes — the writing is the easy part once the evidence is automatic.
Practise hazard data skills questionsWhat the mark scheme rewarded
- Correct working (reading the August value and dividing by 204) for one mark, and the correctly rounded answer of 34% for the second mark
- August is the clear peak month for typhoons reaching Japan, at around a third of the annual total
Traps examiners saw
- Giving the answer to one or two decimal places instead of the nearest whole percentage the question asks for, which caps the mark at 1
- Misreading the August bar height from the graph
Full-mark self-check 0 of 2
1×asked“Using Figure 1, measure the distance travelled by Hurricane Dorian at hurricane force.”
“Using Figure 1, measure the distance travelled by Hurricane Dorian at hurricane force.”
What it’s really asking
Use the map's scale bar to measure only the section of Hurricane Dorian's track marked as hurricane force, not the whole storm track including its weaker tropical-storm-force sections.
What the sources actually showed — June 2022
A map showing the track of Hurricane Dorian across the Atlantic in August and September 2019, with the track colour coded to show tropical-storm-force and hurricane-force sections, alongside a scale bar of 0 to 1000 km.
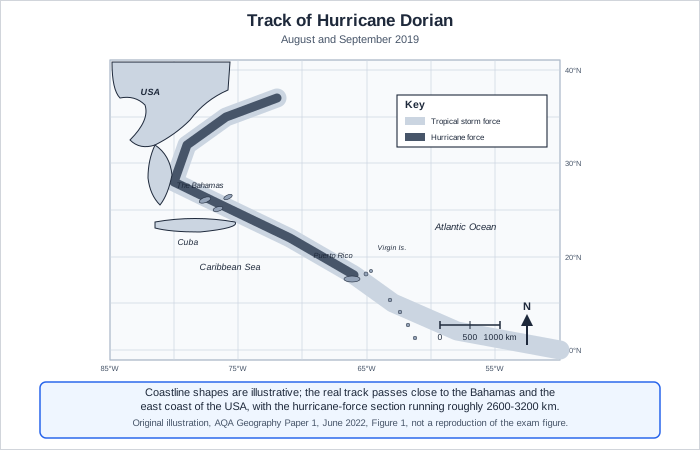
The full worked answer — June 2022
Using the scale bar of 0 to 1000 km, I measure only the section of the track marked as hurricane force, from where it strengthens past the Bahamas to where it weakens again further north. This section measures approximately 2900 km, which sits within the accepted range of 2600 to 3200 km for full marks.
Could you have written this? Every fact in this answer is drilled in our quizzes — the writing is the easy part once the evidence is automatic.
Practise hazard data skills questionsWhat the mark scheme rewarded
- Measuring only the hurricane-force section of the track (not the whole storm track) and giving a distance within the accepted 2600 to 3200 km range for full marks
- Hurricane Dorian's hurricane-force track section measures roughly 2600 to 3200 km using the map's own scale bar
Traps examiners saw
- Measuring the entire track including the weaker tropical-storm-force sections, which gives a distance well outside the accepted range
- Forgetting to use the scale bar and guessing the distance
Full-mark self-check 0 of 2
1×asked“Using Figure 1, by how much did the extent of sea ice change between 1980 and 2016?”
“Using Figure 1, by how much did the extent of sea ice change between 1980 and 2016?”
What it’s really asking
Read the sea ice extent value at 1980 and at 2016 off the line graph and subtract one from the other.
What the sources actually showed — June 2023
A line graph showing average monthly Arctic sea ice extent in September for each year between 1980 and 2020, in millions of square kilometres, falling with a jagged year-to-year pattern from 7.5 in 1980 to a record low of 3.6 in 2012, then recovering slightly to around 4.6 by 2020.
The full worked answer — June 2023
Reading the graph, sea ice extent in 1980 was around 7 million km2, and by 2016 it had fallen to around 4 million km2. Subtracting these gives a change of 3 million km2 over the 36 year period.
Could you have written this? Every fact in this answer is drilled in our quizzes — the writing is the easy part once the evidence is automatic.
Practise hazard data skills questionsWhat the mark scheme rewarded
- Correctly reading the 1980 and 2016 values from the graph and subtracting to give a change of around 3 million km2
- Arctic September sea ice extent fell from around 7 million km2 in 1980 to around 4 million km2 by 2016
Traps examiners saw
- Reading the wrong year off a busy time-series graph
- Giving a percentage change instead of the actual change in million km2 the question asks for
Full-mark self-check 0 of 2
1×asked“Calculate the median number of deaths caused by the tropical storms listed in Figure 4.”
“Calculate the median number of deaths caused by the tropical storms listed in Figure 4.”
What it’s really asking
Order all 14 death tolls in the table from lowest to highest and find the true middle value, averaging the two middle numbers since there is an even count.
What the sources actually showed — June 2023
A table listing 14 major tropical storms between 1970 and 2013, each with the areas affected, the storm's name, and the number of deaths it caused, ranging from 1629 to 300,000.
| Year | Areas affected | Name of storm | Number of deaths |
|---|---|---|---|
| 1970 | Bangladesh | Great Bola | 300000 |
| 1975 | China | Nina | 171000 |
| 1991 | Bangladesh | Gorky | 138866 |
| 2008 | Myanmar | Nargis | 138366 |
| 1985 | Bangladesh | Urir | 15000 |
| 1977 | India | Devi Taluk | 14200 |
| 1998 | Central America | Mitch | 11400 |
| 2013 | Philippines | Haiyan | 6200 |
| 1991 | Philippines | Uring | 5960 |
| 2007 | Bangladesh | Sidr | 4234 |
| 1997 | Vietnam | Linda | 3859 |
| 2004 | USA, Caribbean | Jeanne | 2782 |
| 2005 | USA | Katrina | 1833 |
| 2005 | Central America | Stan | 1629 |
The full worked answer — June 2023
Ordering the 14 death tolls from lowest to highest gives: 1629, 1833, 2782, 3859, 4234, 5960, 6200, 11400, 14200, 15000, 138366, 138866, 171000, 300000. With 14 values, the median is the average of the 7th and 8th values, which are 6200 and 11400, giving a median of 8800 deaths.
Could you have written this? Every fact in this answer is drilled in our quizzes — the writing is the easy part once the evidence is automatic.
Practise hazard data skills questionsWhat the mark scheme rewarded
- The correct median of 8800 deaths, from correctly ordering all 14 values and averaging the two middle ones
- With 14 ordered death tolls, the median is the average of the 7th and 8th values: 6200 and 11400, giving 8800
Traps examiners saw
- Miscounting which two values are the true middle pair in a 14-value list
- Confusing the median with the mean and adding all 14 values instead
Full-mark self-check 0 of 2
The method for every Q01.2 / Q01.3 / Q01.3 / Q01.8 — same every sittingMark bands, steps, timing
What this question type rewards
The topic changes by sitting — the mark scheme never does. Learn this once, then open your question above for that sitting’s sources and a full worked answer.
- Showing working, since a method mark is often available even if the final answer is wrong
- Reading the correct values off the graph, map or table before calculating
- Answering to the precision or units the question actually asks for
The steps
- Identify exactly which values the question needs from the source
- Write down the raw values before calculating, so a method mark is available even if the final figure slips
- Carry out the calculation (percentage, subtraction, median, or distance using the scale)
- Check the rounding or units instruction in the question before writing the final answer
What is the minimum ocean surface temperature required for a tropical storm to form?
These short numeracy questions are quick marks if you show your working. Practise reading graphs, maps and tables accurately before you calculate.
Practise hazard data skills questions“In June 2020 and June 2021, Section B closed with a 9 mark judgement on tropical rainforests, weighing environmental protection against economic development, with no separate SPaG marks (unlike Section A's closing essay).”
This exact rainforest-judgement question type appears in 2 of the 4 sittings we have full papers for. June 2022 and June 2023 replaced it with a different 9 mark question about hot desert or cold environment development instead, covered in a separate cluster.
1×asked“'Some economic activities in tropical rainforests have major environmental impacts.' Do you agree? Use Figure 11 and a case study to explain your answer.”
“'Some economic activities in tropical rainforests have major environmental impacts.' Do you agree? Use Figure 11 and a case study to explain your answer.”
What it’s really asking
Judge how far different rainforest economic activities (shifting cultivation, palm oil, ecotourism, HEP dams) genuinely damage the environment, using a real named case study to support the judgement.
What the sources actually showed — June 2020
Four photographs showing different economic activities in tropical rainforests: shifting cultivation, a palm oil plantation in Indonesia, an ecotourism resort in the Amazon, and a hydro-electric dam in Brazil.
The full worked answer — June 2020
Figure 11's palm oil plantation in Indonesia shows how commercial-scale activity causes major environmental damage: large areas of rainforest are cleared, and because the land only sustains crops for a few years, farmers must clear more forest for new plantations, leaving the exposed soil to erode and chemical fertilisers to leach into the water. In Indonesia specifically, deforestation for palm oil is responsible for around 80% of the whole country's CO2 emissions, making it the third largest emitter of greenhouse gases in the world.
By contrast, the shifting cultivation and ecotourism shown in the same figure have historically had a much smaller environmental impact, since shifting cultivation allows the original cleared area to regenerate once farmers move on, and ecotourism is typically small scale with a focus on conservation. This shows the environmental impact of rainforest economic activities depends heavily on their scale, so I largely agree with the statement, but only for large commercial activities like palm oil and HEP dams, not for small-scale traditional or conservation-focused ones shown in the same figure.
Could you have written this? Every fact in this answer is drilled in our quizzes — the writing is the easy part once the evidence is automatic.
Practise the rainforest judgement essayWhat the mark scheme rewarded
- Detailed knowledge of at least one high-impact and one lower-impact economic activity, applied to Figure 11 with case study support, ending in a coherent judgement
- Palm oil deforestation causes around 80% of Indonesia's total CO2 emissions
- Shifting cultivation and small-scale ecotourism have historically had much smaller environmental impacts
Traps examiners saw
- Describing all four photographs with no real judgement about their relative impact
- Giving a case study with no link at all back to Figure 11
Full-mark self-check 0 of 3
1×asked“'Tropical rainforests should be protected from economic development.' Do you agree? Explain your answer. Use Figure 7 and your own understanding.”
“'Tropical rainforests should be protected from economic development.' Do you agree? Explain your answer. Use Figure 7 and your own understanding.”
What it’s really asking
Weigh the real benefits rainforests provide (carbon storage, biodiversity) against the real benefits economic development brings to local people (jobs, tax revenue), and reach a supported view.
What the sources actually showed — June 2021
Six statements about deforestation in an LIC or NEE: rainforests absorb and store carbon dioxide; animal habitats are destroyed and plant species lost; many people have jobs in mining, logging and farming; companies pay taxes used for services; rainforest products are exported; local people lose their homes.
The full worked answer — June 2021
Figure 7 shows rainforests absorb and store carbon dioxide, and around a quarter of all medicines come from rainforest plants, so protecting rainforests preserves resources with real, ongoing global value that clearing the forest destroys permanently. Once biodiversity is lost through habitat destruction, as the figure also states, plant and animal species cannot simply be replaced, which is a strong reason to prioritise protection.
However, Figure 7 also shows that many people have jobs in mining, logging and farming, and that companies pay taxes which fund local services, so economic development genuinely raises living standards for people who live in or near the rainforest. I judge that rainforests need far stronger protection than they currently have, since the environmental losses from large-scale clearance are permanent, but some carefully managed development, such as selective logging or ecotourism, should still be allowed so that local communities are not denied all economic opportunity.
Could you have written this? Every fact in this answer is drilled in our quizzes — the writing is the easy part once the evidence is automatic.
Practise the rainforest judgement essayWhat the mark scheme rewarded
- A developed account of the case for protection and the case for development, both applied to Figure 7, ending in a supported, balanced judgement
- Rainforests absorb and store carbon dioxide, and provide around a quarter of the world's medicines
- Mining, logging and farming provide real local jobs, and company taxes fund local services
Traps examiners saw
- Arguing only one side (protection or development) with no genuine weighing of the other
- Ignoring Figure 7's own statements and relying purely on outside knowledge
Full-mark self-check 0 of 2
The method for every Q02.9 / Q02.9 — same every sittingMark bands, steps, timing
What this question type rewards
The topic changes by sitting — the mark scheme never does. Learn this once, then open your question above for that sitting’s sources and a full worked answer.
- Developed knowledge of both the environmental case and the economic case, not just one side
- Specific named statistics or examples rather than generic statements
- A genuine, supported judgement rather than a list of points with no conclusion
The steps
- Develop the environmental/protection case with a real statistic or example
- Develop the economic/development case in comparable depth, using the figure
- Bring in a real named case study if the question allows it
- Write an explicit final judgement, not just a list of pros and cons
Where are most nutrients stored in a tropical rainforest ecosystem?
This closing Section B question is worth 9 marks, so both a real protection argument and a real development argument, backed by a genuine judgement, are essential.
Practise the rainforest judgement essay“In June 2022 and June 2023, Section B closed with a 9 mark question letting students choose between a hot desert or a cold environment, always requiring a genuine named case study.”
This exact hot desert/cold environment choice question type appears in 2 of the 4 sittings we have full papers for. June 2020 and June 2021 closed Section B with the rainforest judgement question instead, covered in a separate cluster.
1×asked“Discuss the challenges and opportunities for development in either a hot desert environment or a cold environment. Use either Figure 9 or Figure 10 and a case study.”
“Discuss the challenges and opportunities for development in either a hot desert environment or a cold environment. Use either Figure 9 or Figure 10 and a case study.”
What it’s really asking
Explain the real challenges (extreme temperature, inaccessibility) AND real opportunities (mining, tourism) for developing a hot desert, using a genuine named case study.
What the sources actually showed — June 2022
Two photographs of a hot desert environment: a barren, inhospitable desert landscape, and a large-scale gold mining operation in Western Australia.
The full worked answer — June 2022
Figure 9's barren desert photograph shows the scale of the challenge: with daily temperatures ranging from over 40 degrees C to below freezing at night, and rainfall below 100 mm a year, providing water for industry or people is genuinely difficult, and the huge, sparsely populated area of somewhere like the Thar Desert, which covers around 200,000 sq km, makes transport and services expensive and slow to reach remote communities.
But Figure 9's second photograph, the gold mine in Western Australia, shows real opportunity can outweigh these challenges when resources are valuable enough: large-scale mining brings a strong financial return despite the harsh environment, generating jobs and investment. The Thar Desert case study shows the same pattern on a smaller scale, since limestone and gypsum mining supports the construction industry there, and a genuine, growing tourism trade has developed around the honeypot city of Jaisalmer, even though development beyond that city remains very limited. I judge that hot deserts offer real economic opportunity, but only where the value of the resource or attraction is high enough to justify overcoming the extreme challenges.
Could you have written this? Every fact in this answer is drilled in our quizzes — the writing is the easy part once the evidence is automatic.
Practise the extreme environment case study essayWhat the mark scheme rewarded
- Detailed knowledge of both challenges and opportunities for development in a hot desert, applied to the figure with genuine case study support
- Hot deserts see temperatures from over 40 degrees C by day to below freezing at night, with rainfall under 100 mm a year
- The Thar Desert (200,000 sq km) supports limestone/gypsum mining and growing tourism around Jaisalmer
Traps examiners saw
- Discussing only challenges or only opportunities, which caps the answer at Level 2
- Choosing both hot desert and cold environment and mixing them together, when the mark scheme only credits the stronger single answer
Full-mark self-check 0 of 3
1×asked“Extreme environments provide opportunities for economic development. These opportunities include energy, farming, fishing, mining and tourism. Choose either a hot desert environment or a cold environment. Discuss the opportunities for economic development in your chosen environment. Use a case study and your own understanding.”
“Extreme environments provide opportunities for economic development. These opportunities include energy, farming, fishing, mining and tourism. Choose either a hot desert environment or a cold environment. Discuss the opportunities for economic development in your chosen environment. Use a case study and your own understanding.”
What it’s really asking
Discuss several distinct real economic opportunities (not challenges this time) available in a hot desert, using a genuine named case study, and judge how far these opportunities can really be exploited.
The full worked answer — June 2023
In the south west United States, a hot desert HIC example, opportunities for development include large-scale commercial farming supported by irrigation, extensive mining activity, and tourism developed on a large scale, including retirement communities built to take advantage of the warm, dry climate. In a poorer example like the Thar Desert, opportunities include subsistence and commercial farming supported by irrigation, mining of limestone and gypsum for the construction industry, hydroelectric power, and a growing tourism industry.
The degree to which these opportunities can actually be developed depends on the availability of water, the physical terrain, extremes of temperature, the technology available, and how much money is invested, so while hot deserts have real economic potential across farming, mining and tourism, that potential is only partly realised because the desert ecosystem is fragile and development is not always sustainable in the long term.
Could you have written this? Every fact in this answer is drilled in our quizzes — the writing is the easy part once the evidence is automatic.
Practise the extreme environment case study essayWhat the mark scheme rewarded
- Detailed knowledge of several distinct development opportunities in a hot or cold environment, with genuine case study support and discussion of how far they can be realised
- South west USA: commercial farming, large-scale mining, large-scale tourism and retirement development
- Thar Desert: irrigation-supported farming, limestone/gypsum mining, hydroelectric power, growing tourism
Traps examiners saw
- Listing opportunities without any named case study support
- Discussing only one type of opportunity (e.g. only tourism) instead of the range the command word 'discuss' expects
Full-mark self-check 0 of 3
The method for every Q02.9 / Q02.10 — same every sittingMark bands, steps, timing
What this question type rewards
The topic changes by sitting — the mark scheme never does. Learn this once, then open your question above for that sitting’s sources and a full worked answer.
- Committing to one environment (hot desert or cold) and developing it in real depth, rather than mixing both
- A genuine, named case study with real facts, not a generic description
- Discussing several distinct opportunities or challenges, not just one repeated
The steps
- Tick or state clearly which environment you are answering on, and stick to it
- Bring in a real named case study with genuine facts
- Cover more than one distinct opportunity or challenge
- If the question allows, discuss how far the opportunities can really be exploited
At which latitudes are most of the world's hot deserts found?
This question always offers a choice between hot desert and cold environment. Prepare one strong, fact-rich case study for whichever you choose, rather than a shallow answer for both.
Practise the extreme environment case study essay“Every sitting we have full papers for includes a 6 mark, three-level judgement question partway through Section B, always instructing students to use the given figure and their own understanding.”
This 6 mark Section B question recurs in all 4 sittings, though the exact topic shifts between hot desert/cold environment management, challenges to development, rainforest plant adaptation, and deforestation impacts.
1×asked“Suggest how different strategies are used to reduce environmental damage in either: an area on the fringe of a hot desert or a cold environment. Use Figure 8 or Figure 9 and your own understanding.”
“Suggest how different strategies are used to reduce environmental damage in either: an area on the fringe of a hot desert or a cold environment. Use Figure 8 or Figure 9 and your own understanding.”
What it’s really asking
Explain how two real management strategies reduce desertification or environmental damage on the fringe of a hot desert, using the Sahel example given.
What the sources actually showed — June 2020
A map and photograph showing strategies to reduce the risk of desertification in the Sahel, Africa: the Great Green Wall tree-planting scheme, and a person building rock walls (bunds).
The full worked answer — June 2020
The Great Green Wall scheme, shown in Figure 8, plants trees across the southern edge of the Sahara to reduce desertification, since the trees counter soil erosion, slow wind speeds and physically stop the desert spreading further; by 2030 the scheme aims to restore 100 million hectares of degraded land, and has already restored 15 million hectares in Ethiopia and planted 11.4 million trees in Senegal.
Building rock walls, or bunds, shown in the same figure, is an appropriate low-cost technology that follows the contour of the land to capture rainwater running downhill, trapping sediment that would otherwise wash away and building up a good depth of soil for cultivation. Together, these two strategies show how both large-scale tree planting and small-scale local technology can reduce environmental damage on a desert fringe, tackling the problem from very different angles but with the same underlying goal of holding soil and water in place.
Could you have written this? Every fact in this answer is drilled in our quizzes — the writing is the easy part once the evidence is automatic.
Practise Section B judgement questionsWhat the mark scheme rewarded
- Thorough understanding of how at least one real management strategy reduces environmental damage on a hot desert fringe, applied to Figure 8 or 9 with own understanding
- The Great Green Wall aims to restore 100 million hectares of land by 2030, with 15 million hectares already restored in Ethiopia
- Rock walls (bunds) capture rainwater and trap sediment to build up cultivable soil
Traps examiners saw
- Describing a strategy without explaining how it actually reduces environmental damage
- Choosing hot desert but describing a cold-environment strategy by mistake
Full-mark self-check 0 of 2
1×asked“Assess the importance of inaccessibility and extreme temperatures as challenges to development in one of the following environments: Hot desert environment / Cold environment. Use a case study and your own understanding.”
“Assess the importance of inaccessibility and extreme temperatures as challenges to development in one of the following environments: Hot desert environment / Cold environment. Use a case study and your own understanding.”
What it’s really asking
Judge which is the bigger barrier to development in a hot desert, extreme temperature or inaccessibility, using a real named case study for support.
The full worked answer — June 2021
In the Thar Desert, temperatures can exceed 50 degrees C in summer, making it too hot for people to farm, work in mines, or act as tourist guides during those months, which directly limits how much economic activity can take place there. Inaccessibility compounds this problem, since the desert covers around 200,000 sq km, most of it reachable only with poor infrastructure, meaning development is concentrated almost entirely around the honeypot city of Jaisalmer while the rest of the desert remains largely undeveloped.
Weighing the two, I judge that inaccessibility is the more important barrier in the Thar Desert, since extreme heat only stops work for part of the year, but poor infrastructure permanently limits access to most of the desert's area, creating greater differences between the wealthy honeypot of Jaisalmer and the rest of the region. Both challenges clearly matter, but a place can adapt working hours around heat far more easily than it can build entirely new infrastructure across 200,000 sq km of harsh terrain.
Could you have written this? Every fact in this answer is drilled in our quizzes — the writing is the easy part once the evidence is automatic.
Practise Section B judgement questionsWhat the mark scheme rewarded
- Detailed understanding of both inaccessibility and extreme temperatures as challenges, supported by a real case study, with a reasoned judgement on their relative importance
- Thar Desert temperatures can exceed 50 degrees C in summer, halting farming, mining and tourism work
- The Thar Desert covers around 200,000 sq km, with development concentrated almost entirely around Jaisalmer
Traps examiners saw
- Discussing only one challenge (temperature or inaccessibility) rather than both
- Writing with no case study at all, which limits the answer to a lower level
Full-mark self-check 0 of 3
1×asked“Suggest how plants are adapted to the climate in tropical rainforests. Use Figure 6 and your own understanding.”
“Suggest how plants are adapted to the climate in tropical rainforests. Use Figure 6 and your own understanding.”
What it’s really asking
Link specific real plant features (buttress roots, drip tips, thin bark) directly to the climate data shown in the graph (constant high temperature, very high year-round rainfall).
What the sources actually showed — June 2022
A climate graph for Iquitos, Peru, showing uniformly high monthly temperatures of around 28 to 29 degrees C and high rainfall in every month, varying from around 150 mm in August to 350 mm in March, totalling over 2000 mm a year.
The full worked answer — June 2022
Figure 6 shows temperatures staying at a consistently high 28 to 29 degrees C all year, so plants can grow continuously without a dormant season, which is why rainforest trees like those shown drop their leaves gradually throughout the year rather than all at once, allowing them to keep photosynthesising and competing for light year round.
With rainfall never falling below around 150 mm even in the driest month, leaves have developed drip tips that channel the constant heavy rain off quickly so the leaf does not break under the weight of water, while buttress roots have evolved to support trees that grow extremely tall, over 50 metres in some cases, in the fierce competition for sunlight created by such favourable, constant growing conditions. These adaptations show how the rainforest's specific combination of constant heat and high rainfall, rather than a general 'hot and wet' climate, shapes exactly how the vegetation has evolved.
Could you have written this? Every fact in this answer is drilled in our quizzes — the writing is the easy part once the evidence is automatic.
Practise Section B judgement questionsWhat the mark scheme rewarded
- Thorough geographical understanding of how plants are adapted to the rainforest climate, with specific interpretation of the climate graph in Figure 6
- Iquitos stays at 28-29 degrees C year round with rainfall never below around 150 mm a month
- Drip-tip leaves shed heavy rain quickly; buttress roots support trees over 50 metres tall
Traps examiners saw
- Describing adaptations with no link at all to the actual climate graph figures
- Only describing the climate shown in Figure 6 without naming any actual plant adaptation
Full-mark self-check 0 of 2
1×asked“'Tropical rainforest deforestation has major economic and environmental impacts.' Do you agree? Use Figure 10 and your own understanding to explain your answer.”
“'Tropical rainforest deforestation has major economic and environmental impacts.' Do you agree? Use Figure 10 and your own understanding to explain your answer.”
What it’s really asking
Judge how far deforestation's economic benefits (jobs, exports) are outweighed by its environmental costs (carbon release, biodiversity loss), using the real statistics given in the factfile.
What the sources actually showed — June 2023
A factfile on deforestation: rainforests hold over 50% of the world's plant and animal species; deforestation from 2001 to 2019 released 105 gigatonnes of CO2; cattle ranching accounts for 80% of Brazil's current deforestation; Indonesia's forests are cleared for oil palm plantations; bauxite, iron ore, manganese, gold and diamonds are mined in tropical forests; removing forest increases flooding and soil erosion risk.
The full worked answer — June 2023
The economic impacts are real: cattle ranching, responsible for 80% of Brazil's current deforestation according to Figure 10, brings in valuable export income from beef, while mining bauxite, iron ore and gold generates further revenue and employment in forested areas. But the environmental cost is severe and, unlike the short-term economic gain, largely irreversible: deforestation released 105 gigatonnes of CO2 between 2001 and 2019 alone, and clearing habitat for over 50% of the world's plant and animal species risks permanent extinctions that cannot later be undone.
Removing forest cover also increases flooding and soil erosion risk, as Figure 10 states, which brings further long-term economic costs to local communities through damaged farmland and property, on top of the immediate loss of habitat. I agree that deforestation has major economic and environmental impacts, but I judge the environmental impacts are ultimately the more serious of the two, since lost biodiversity and the CO2 already released cannot be reversed the way short-term economic losses eventually can be recovered from.
Could you have written this? Every fact in this answer is drilled in our quizzes — the writing is the easy part once the evidence is automatic.
Practise Section B judgement questionsWhat the mark scheme rewarded
- Thorough understanding of both economic and environmental impacts of deforestation, applied to Figure 10's real statistics, with an explicit assessment of severity
- Cattle ranching accounts for 80% of Brazil's current deforestation
- Deforestation released 105 gigatonnes of CO2 between 2001 and 2019
Traps examiners saw
- Simply copying Figure 10's statements without any comment or development
- Discussing only economic or only environmental impacts, which limits the answer to Level 2
Full-mark self-check 0 of 3
The method for every Q02.6 / Q02.5 / Q02.4 / Q02.9 — same every sittingMark bands, steps, timing
What this question type rewards
The topic changes by sitting — the mark scheme never does. Learn this once, then open your question above for that sitting’s sources and a full worked answer.
- Applying real, specific facts to the figure, not just describing it
- Developing two distinct points in real depth
- Reaching a genuine judgement where the command word requires one
The steps
- Read the command word carefully and note whether a judgement is required
- Use the figure explicitly, quoting a real number or detail from it
- Develop two distinct points rather than listing many shallow ones
- If asked, reach an explicit final judgement
Where are most nutrients stored in a tropical rainforest ecosystem?
This 6 mark question always needs the figure used explicitly. Practise pulling real numbers from graphs and factfiles rather than writing from memory alone.
Practise Section B judgement questions“Section B regularly opens with a short question on the basics of producers and consumers, whether naming them in a real ecosystem, describing their role, reading a food web diagram, or linking them together.”
Questions of this shape appear in 2 of the 4 sittings we have full papers for (June 2020 and June 2023), always near the very start of Section B, each testing a slightly different angle on the same basic producer/consumer knowledge.
1×asked“For a small scale ecosystem you have studied, name one producer and one consumer.”
“For a small scale ecosystem you have studied, name one producer and one consumer.”
What it’s really asking
Name a real producer and a real consumer that genuinely belong to the SAME small-scale ecosystem you have studied, not two organisms from different habitats.
The full worked answer — June 2020
In a freshwater pond ecosystem, pondweed is a producer, since it makes its own food through photosynthesis, and a tadpole is a consumer, since it feeds on the pondweed and other organic matter in the same pond.
Could you have written this? Every fact in this answer is drilled in our quizzes — the writing is the easy part once the evidence is automatic.
Practise producer and consumer basicsWhat the mark scheme rewarded
- A correct producer and a correct consumer from the same named small-scale ecosystem, one mark each
- Pondweed (producer) and tadpoles (consumer) both belong to the same freshwater pond ecosystem
Traps examiners saw
- Naming a producer and consumer from two different ecosystems, which caps the mark at 1
- Naming a decomposer instead of a genuine primary or later consumer
Full-mark self-check 0 of 1
1×asked“What is the role of producers in an ecosystem?”
“What is the role of producers in an ecosystem?”
What it’s really asking
Describe what a producer actually does in an ecosystem (makes its own food via photosynthesis, forms the base of the food chain), not just name an example of one.
The full worked answer — June 2020
Producers convert sunlight, water and carbon dioxide into food through photosynthesis, making their own energy rather than consuming another organism, which places them at the base of the food chain so that every other organism ultimately depends on the energy they capture.
Could you have written this? Every fact in this answer is drilled in our quizzes — the writing is the easy part once the evidence is automatic.
Practise producer and consumer basicsWhat the mark scheme rewarded
- A correct description of the producer's role: making its own food by photosynthesis and forming the base of the food chain
- Producers convert sunlight, water and CO2 into food through photosynthesis, forming the base of the food chain
Traps examiners saw
- Naming an example of a producer instead of describing its role, which earns no credit
Full-mark self-check 0 of 1
1×asked“Using Figure 7, identify a producer.”
“Using Figure 7, identify a producer.”
What it’s really asking
Pick out the organism in the food web diagram that sits at the very start of the arrows, the one nothing else in the diagram feeds on, and everything else ultimately feeds from.
What the sources actually showed — June 2023
A diagram of a food web, with several organisms connected by arrows showing feeding relationships, including a large water plant at the base of the web.
The full worked answer — June 2023
The large water plant sits at the base of the food web in Figure 7, with arrows leading away from it towards several consumers, showing it makes its own food through photosynthesis rather than feeding on any other organism in the diagram.
Could you have written this? Every fact in this answer is drilled in our quizzes — the writing is the easy part once the evidence is automatic.
Practise producer and consumer basicsWhat the mark scheme rewarded
- Correctly identifying the large water plant as the producer, the organism at the base of the food web with arrows leading away from it
- In a food web diagram, the producer is the organism at the base, with arrows leading away from it, not towards it
Traps examiners saw
- Picking an organism with arrows pointing both in and out, which is a consumer, not a producer
Full-mark self-check 0 of 1
1×asked“For a small-scale ecosystem that you have studied, outline the link between producers and consumers.”
“For a small-scale ecosystem that you have studied, outline the link between producers and consumers.”
What it’s really asking
Explain HOW a named producer feeds a named consumer in one specific small-scale ecosystem, not just state that consumers eat producers in general.
The full worked answer — June 2023
In a freshwater pond ecosystem, producers such as pond weed and duckweed make their own food using sunlight through photosynthesis, and this becomes the basic source of energy that consumers such as snails and flatworms feed on directly by eating the plant material, passing that energy along to whatever feeds on them in turn.
Could you have written this? Every fact in this answer is drilled in our quizzes — the writing is the easy part once the evidence is automatic.
Practise producer and consumer basicsWhat the mark scheme rewarded
- A clear link between a named producer and a named consumer within one specific small-scale ecosystem, for 2 marks
- Pond weed and duckweed (producers) are eaten directly by snails and flatworms (consumers) in a freshwater pond
Traps examiners saw
- Simply stating 'consumers eat producers' in general with no named ecosystem, which caps the mark at 1
- Naming a large-scale ecosystem like a hot desert instead of a genuinely small-scale one
Full-mark self-check 0 of 2
The method for every Q02.1 / Q02.2 / Q02.1 / Q02.4 — same every sittingMark bands, steps, timing
What this question type rewards
The topic changes by sitting — the mark scheme never does. Learn this once, then open your question above for that sitting’s sources and a full worked answer.
- Naming a genuinely small-scale ecosystem, not a large biome like a hot desert
- Making sure a named producer and consumer genuinely belong to the SAME ecosystem
- Describing the actual role or link, not just stating a fact in isolation
The steps
- Pick one small-scale ecosystem you know well (a pond, a hedgerow, a rock pool) and stick to it
- Name a real producer and a real consumer from that same ecosystem
- If asked for a role or link, explain the mechanism (photosynthesis, feeding), not just the label
What is an ecosystem?
Have one small-scale ecosystem (like a pond) ready with a real producer and consumer, so you never lose an easy mark by mixing two different habitats together.
Practise producer and consumer basics“Whenever a student answers Question 3 (Coasts), it includes a 4 mark question explaining the formation of a specific coastal landform, always level marked across two bands.”
This question type recurs in 3 of the 4 sittings we have full papers for (June 2021, June 2022, June 2023), covering a spit, a wave-cut platform, and spits and bars respectively. June 2020's Question 3 tested the benefits of hard engineering at this same tariff instead.
1×asked“Explain the formation of a spit.”
“Explain the formation of a spit.”
What it’s really asking
Explain the sequence of longshore drift transporting material past a bend in the coastline, depositing it out into open water, and the recurved end forming, in the right order.
The full worked answer — June 2021
Longshore drift transports sand and shingle along the coast in the direction the prevailing wind blows the waves. Where the coastline suddenly changes direction, such as at a river mouth or estuary, the material carried by longshore drift continues travelling in roughly the same direction rather than following the coast, so it begins to build up in the sheltered water on the lee side of the bend.
As more material is added, the deposit grows out into the sea to form a long ridge of sand or shingle joined to the land at one end. Strong winds and waves can then curve the exposed end of the spit back towards the shore, forming a recurved end, while finer sediment is carried further into the deeper water of the estuary and deposited there as the water loses its capacity to transport it any further.
Could you have written this? Every fact in this answer is drilled in our quizzes — the writing is the easy part once the evidence is automatic.
Practise coastal landform formationWhat the mark scheme rewarded
- Accurate knowledge of the erosion/transport process (longshore drift) and a clear, developed sequence of how a spit forms, including the recurved end
- Longshore drift deposits material where the coastline changes direction, e.g. at an estuary mouth
- The exposed end of a spit can curve into a recurved end under wind and wave action
Traps examiners saw
- Describing longshore drift in general with no link to how a spit specifically forms
- Missing the sequence of formation and just listing isolated facts
Full-mark self-check 0 of 2
1×asked“Explain how a wave cut platform is formed as a cliff is eroded. Use one or more diagrams to support your answer.”
“Explain how a wave cut platform is formed as a cliff is eroded. Use one or more diagrams to support your answer.”
What it’s really asking
Explain the repeating cycle of notch formation, cliff collapse, and retreat that leaves a wave-cut platform behind, in the correct order.
The full worked answer — June 2022
Waves cause the most erosion at the base of a cliff, between the high and low water marks, through hydraulic action (the sheer power of waves smashing into the rock, forcing trapped air into cracks until they widen) and abrasion (fragments of rock hurled by the sea wearing away the cliff face). Over time this erosion cuts a wave-cut notch into the base of the cliff.
As the notch grows deeper, the rock above it becomes unsupported and eventually collapses, and the backwash then washes the collapsed material away, exposing a new section of cliff face for a fresh notch to form. This process repeats over and over, causing the whole cliff to retreat further inland, and the smoothed, gently sloping rock surface left behind at the base, where the cliff used to stand, is the wave-cut platform.
Could you have written this? Every fact in this answer is drilled in our quizzes — the writing is the easy part once the evidence is automatic.
Practise coastal landform formationWhat the mark scheme rewarded
- Accurate knowledge of hydraulic action and abrasion forming a notch, and a clear explanation of the repeating collapse-and-retreat sequence that leaves a wave-cut platform, with a labelled diagram needed alongside the writing to reach full marks
- Hydraulic action and abrasion cut a wave-cut notch into the base of a cliff
- Repeated collapse and retreat leaves a smoothed wave-cut platform behind
Traps examiners saw
- Naming erosion processes without linking them to the notch specifically
- Describing only the final platform without explaining the repeating process that created it
- Skipping the labelled diagram the question explicitly asks for, which the real mark scheme caps at the lower end of Level 2 without one, even with excellent writing
Full-mark self-check 0 of 3
1×asked“Explain how spits and bars form along the coast as a result of deposition.”
“Explain how spits and bars form along the coast as a result of deposition.”
What it’s really asking
Explain the deposition process (longshore drift) forming a spit, AND separately explain how the same process can form a bar when a spit grows all the way across a bay, trapping a lagoon.
The full worked answer — June 2023
Longshore drift carries sand and shingle along the coast, with the swash moving material up the beach at the angle of the prevailing wind and the backwash pulling it straight back down the beach, so over time material zigzags along the shore. Where the coastline changes direction sharply, such as at a river mouth, this drifting material continues past the bend and is deposited in the sheltered water beyond it, gradually building into a spit.
If longshore drift causes a spit to keep growing until it stretches all the way across a bay, it traps a body of water, usually freshwater, behind it, and this complete barrier is called a bar rather than a spit. This shows a bar is really just a spit that has grown far enough to fully close off the bay it started forming across, so the same deposition process produces both landforms, only the amount of material deposited and the shape of the coastline decide which one results.
Could you have written this? Every fact in this answer is drilled in our quizzes — the writing is the easy part once the evidence is automatic.
Practise coastal landform formationWhat the mark scheme rewarded
- A clear explanation of longshore drift depositing material to form a spit, AND how the same process can close off a bay to form a bar, both required for the top of Level 2
- Swash and backwash cause the zigzag movement of longshore drift along the coast
- A spit that grows all the way across a bay traps water behind it and becomes a bar
Traps examiners saw
- Explaining only a spit with no mention of a bar at all, which limits the answer below the top of Level 2
- Describing longshore drift in general with no link to either specific landform
Full-mark self-check 0 of 2
The method for every Q03.5 / Q03.6 / Q03.5 — same every sittingMark bands, steps, timing
What this question type rewards
The topic changes by sitting — the mark scheme never does. Learn this once, then open your question above for that sitting’s sources and a full worked answer.
- Naming the real process involved (longshore drift, hydraulic action, abrasion), not just describing the outcome
- Explaining the correct SEQUENCE of formation, step by step
- Developing both stages if two landforms or two processes are named in the question
The steps
- Name the real process (longshore drift, hydraulic action, abrasion) driving the formation
- Explain each step of the sequence in order, not just the end result
- If the question names two landforms or a diagram request, cover both, or draw and label a diagram
- Use the correct geographical terms (notch, backwash, recurved end) throughout
Which of the following best describes a destructive wave?
This question always wants the SEQUENCE of formation, not just the finished landform. Practise explaining each stage in order, using the right process names.
Practise coastal landform formation“Whenever a student answers Question 4 (Rivers), it includes a 4 mark question explaining the formation of a specific river landform, always level marked across two bands.”
This question type recurs in 3 of the 4 sittings we have full papers for (June 2020, June 2021, June 2022), covering levées, an ox-bow lake, and a meander respectively. June 2023's Question 4 tested physical factors affecting flood risk at this same tariff instead.
1×asked“Explain how river levées are formed.”
“Explain how river levées are formed.”
What it’s really asking
Explain the sequence of repeated flooding, deposition of coarser material closest to the bank, and the gradual build-up of raised banks over many flood events.
The full worked answer — June 2020
Levées form in the lower course of a river, where an increase in the volume of water flowing downstream causes the river to flood over its banks. As floodwater spreads out across the floodplain, friction with the land surface suddenly slows the water down, and this loss of energy forces the river to deposit the sediment it was carrying.
The largest, heaviest material such as sand and gravel is dropped first, right at the edge of the channel, while finer silt and mud is carried further out across the floodplain before settling. After many repeated flood events, this coarser material builds up along the riverbank, gradually raising its height until the banks stand higher than the rest of the floodplain, forming levées that can eventually burst during a severe flood.
Could you have written this? Every fact in this answer is drilled in our quizzes — the writing is the easy part once the evidence is automatic.
Practise river landform formationWhat the mark scheme rewarded
- Accurate knowledge of deposition during flooding and a clear sequence of how repeated floods raise the riverbank into a levée
- Friction with the floodplain during a flood slows water and forces deposition of coarse material nearest the bank
- Repeated flood events gradually raise the bank height above the surrounding floodplain
Traps examiners saw
- Describing flooding in general with no link to why levées specifically build up
- Missing the coarse-material-nearest-the-bank detail, which weakens the sequence
Full-mark self-check 0 of 2
1×asked“Explain the formation of an ox-bow lake.”
“Explain the formation of an ox-bow lake.”
What it’s really asking
Explain the sequence from a meander's neck narrowing through erosion, to the river cutting through during a flood, to deposition sealing off the old meander as a lake.
The full worked answer — June 2021
A meander is a winding bend in a river, where lateral erosion undercuts the outer bank, since the water flows fastest there with the least friction, while material is deposited on the inner bank where the flow is slower. Over time this erosion and deposition makes the meander loop tighter, and the narrow neck of land between two closely curving bends gradually erodes further until it becomes very thin.
During a flood, when the river carries much more water, it breaks straight through this narrow neck, cutting a new, shorter and steeper channel and bypassing the old meander loop entirely. Deposition then builds up at the edges of this new straight section, sealing off the old loop from the main channel, so it becomes a separate, curved ox-bow lake which will gradually silt up into marshland over time.
Could you have written this? Every fact in this answer is drilled in our quizzes — the writing is the easy part once the evidence is automatic.
Practise river landform formationWhat the mark scheme rewarded
- Accurate knowledge of erosion and deposition narrowing a meander neck, and a clear sequence of the flood breakthrough and deposition that seals off the ox-bow lake
- Lateral erosion on the outer bank and deposition on the inner bank narrows a meander's neck over time
- A flood cuts through the narrow neck, and deposition then seals off the old loop as an ox-bow lake
Traps examiners saw
- Starting the explanation at the flood breakthrough without first explaining how the meander neck narrowed
- Describing meanders in general with no reference to the specific ox-bow lake sequence
Full-mark self-check 0 of 2
1×asked“Explain how a meander may be formed by both erosion and deposition. Use one or more diagrams to support your answer.”
“Explain how a meander may be formed by both erosion and deposition. Use one or more diagrams to support your answer.”
What it’s really asking
Explain how erosion on the outer bank and deposition on the inner bank work together, in the same bend, to make a river's course increasingly curved over time.
The full worked answer — June 2022
In a meander bend, water flows fastest on the outer side of the curve, where the channel is deepest and there is least friction with the bed and banks. This fast-flowing water erodes the outer bank laterally, undercutting it to form a steep river cliff, so the outer bank retreats further into the surrounding land over time.
On the inner side of the same bend, the water flows more slowly and there is more friction with the shallower bed, so the river loses the energy to carry its sediment load and deposits it there instead, building up a gently sloping slip-off slope. Because erosion on the outer bank and deposition on the inner bank happen at the same time in the same bend, the meander becomes progressively more curved and can gradually migrate across the floodplain over many years.
Could you have written this? Every fact in this answer is drilled in our quizzes — the writing is the easy part once the evidence is automatic.
Practise river landform formationWhat the mark scheme rewarded
- Accurate knowledge of erosion on the outer bank and deposition on the inner bank, explained as parts of the same simultaneous process that shapes a meander, with a labelled diagram needed alongside the writing to reach full marks
- Fast flow and least friction on the outer bank causes lateral erosion and undercutting
- Slower flow and more friction on the inner bank causes deposition, forming a slip-off slope
Traps examiners saw
- Explaining only erosion or only deposition, when the question explicitly asks for both
- Treating erosion and deposition as happening in two separate bends rather than the same one
- Skipping the labelled diagram the question explicitly asks for, which the real mark scheme caps at the lower end of Level 2 without one, even with excellent writing
Full-mark self-check 0 of 4
The method for every Q04.5 / Q04.5 / Q04.6 — same every sittingMark bands, steps, timing
What this question type rewards
The topic changes by sitting — the mark scheme never does. Learn this once, then open your question above for that sitting’s sources and a full worked answer.
- Naming the real process involved (erosion, deposition, lateral erosion), not just the outcome
- Explaining the correct SEQUENCE of formation, step by step
- Linking erosion and deposition together where the question asks for both
The steps
- Name the real process (lateral erosion, deposition, flooding) driving the formation
- Explain each step of the sequence in order, not just the end result
- If the question names two processes, such as erosion and deposition, cover both in equal depth
- Use the correct geographical terms (slip-off slope, river cliff, neck) throughout
Which of the following best describes the erosion process of abrasion?
This question always wants the SEQUENCE of formation, not just the finished landform. Practise explaining each stage in order, using the right process names.
Practise river landform formation“Whenever a student answers Question 5 (Glacial), it includes a 4 mark question explaining the formation of a specific glacial landform, always level marked across two bands.”
This question type recurs in 3 of the 4 sittings we have full papers for (June 2021, June 2022, June 2023), covering a hanging valley, a glacial trough, and a corrie respectively. June 2020's Question 5 tested economic opportunities in glaciated areas at this same tariff instead.
1×asked“Explain the formation of a hanging valley.”
“Explain the formation of a hanging valley.”
What it’s really asking
Explain why a smaller tributary glacier erodes a shallower valley than the larger main glacier, so that when the ice melts, the smaller valley is left 'hanging' above the main valley floor.
The full worked answer — June 2021
A hanging valley starts as a smaller tributary glacier joining a larger main glacier that occupies the main valley. Both glaciers erode their valleys through abrasion, where rock fragments frozen into the ice scrape the bedrock like sandpaper, and plucking, where the ice freezes onto the rock and tears pieces away as it moves.
Because the main glacier is much larger and therefore has far more erosive power than the smaller tributary glacier, it erodes its valley floor much deeper. When the ice eventually melts, the smaller tributary valley is left 'hanging' high above the floor of the much deeper main valley, and a river flowing through the hanging valley often plunges down to the main valley floor as a waterfall.
Could you have written this? Every fact in this answer is drilled in our quizzes — the writing is the easy part once the evidence is automatic.
Practise glacial landform formationWhat the mark scheme rewarded
- Accurate knowledge of abrasion and plucking, and a clear explanation of why a smaller tributary glacier leaves a shallower, hanging valley compared with the main glacier's deeper trough
- Abrasion and plucking erode both the tributary and the main glacial valley
- The larger main glacier erodes a much deeper valley, leaving the tributary valley hanging above it once the ice melts
Traps examiners saw
- Explaining general glacial erosion without ever explaining WHY one valley ends up higher than the other
- Forgetting to mention the resulting waterfall or the size difference between the two glaciers
Full-mark self-check 0 of 2
1×asked“Explain the formation of a glacial trough (U-shaped valley). Use one or more diagrams to support your answer.”
“Explain the formation of a glacial trough (U-shaped valley). Use one or more diagrams to support your answer.”
What it’s really asking
Explain how a glacier occupying a former V-shaped river valley widens and deepens it through erosion, and removes the interlocking spurs to leave a U-shaped valley.
The full worked answer — June 2022
A glacial trough begins as a former V-shaped river valley that ice comes to occupy, fed by several tributary glaciers starting in corries higher up the mountain. As these tributary glaciers join the main valley glacier, the ice erodes powerfully through abrasion, where moraine trapped in the ice sandpapers both the sides and base of the valley, and plucking, where the ice freezes onto jointed rock and tears pieces away as it flows downhill.
Because a glacier is a much wider, thicker mass of ice than a river, it widens and deepens the valley far beyond what the original river could achieve, straightening the valley's course by eroding away the interlocking spurs that a river valley would normally have. This leaves behind a valley with a broad, flat floor and very steep sides, the classic U-shaped cross-profile of a glacial trough, and after the ice melts, glacial debris and meltwater may leave ribbon lakes in hollows along the valley floor.
Could you have written this? Every fact in this answer is drilled in our quizzes — the writing is the easy part once the evidence is automatic.
Practise glacial landform formationWhat the mark scheme rewarded
- Accurate knowledge of abrasion and plucking, and a clear explanation of how a glacier widens, deepens and straightens a former V-shaped valley into a U-shaped trough, with a labelled diagram needed alongside the writing to reach full marks
- A glacier occupies a former V-shaped river valley, fed by tributary glaciers from corries
- The glacier's greater width removes interlocking spurs, leaving a flat-floored, steep-sided U-shaped trough
Traps examiners saw
- Describing corrie formation instead of the trough itself, which answers the wrong landform
- Never mentioning the original V-shaped river valley the trough started as
- Skipping the labelled diagram the question explicitly asks for, which the real mark scheme caps at the lower end of Level 2 without one, even with excellent writing
Full-mark self-check 0 of 3
1×asked“Explain how corries form as a result of glacial erosion.”
“Explain how corries form as a result of glacial erosion.”
What it’s really asking
Explain the sequence from snow collecting in a north-facing hollow, through rotational sliding, plucking and abrasion deepening the hollow, to the rock lip trapping meltwater as a tarn.
The full worked answer — June 2023
A corrie begins as snow collects in a hollow on a mountainside, typically facing north or north-east in the UK so it is less exposed to direct sunshine and the snow does not melt away each summer. Over time the snow compresses into glacier ice, and as gravity encourages this small corrie glacier to move downhill by rotational sliding, freeze-thaw weathering combined with plucking loosens and removes material from the back wall, making it steeper.
The plucked debris dragged along the base of the glacier then causes further erosion through abrasion, deepening the hollow into a rock basin, while erosion at the front edge of the corrie is weaker, so a rock lip or sill builds up there, sometimes raised further by deposited moraine. When the ice eventually melts, this rock lip acts as a natural dam, trapping meltwater behind it to form a round corrie lake, or tarn.
Could you have written this? Every fact in this answer is drilled in our quizzes — the writing is the easy part once the evidence is automatic.
Practise glacial landform formationWhat the mark scheme rewarded
- Accurate knowledge of rotational sliding, plucking and abrasion, and a clear sequence ending with the rock lip trapping meltwater to form a tarn
- Snow collects in a north or north-east facing hollow, less exposed to direct sunshine
- A rock lip at the front of the corrie later dams meltwater into a tarn once the ice melts
Traps examiners saw
- Never mentioning why the hollow faces north or north-east in the UK
- Missing the rock lip and tarn at the end of the sequence
Full-mark self-check 0 of 2
The method for every Q05.5 / Q05.6 / Q05.5 — same every sittingMark bands, steps, timing
What this question type rewards
The topic changes by sitting — the mark scheme never does. Learn this once, then open your question above for that sitting’s sources and a full worked answer.
- Naming the real erosion processes (abrasion, plucking, rotational sliding), not just the outcome
- Explaining the correct SEQUENCE of formation, step by step
- Using labelled diagrams where the question invites them, since a clear diagram can substitute for written text
The steps
- Name the real erosion processes (abrasion, plucking, rotational sliding) driving the formation
- Explain each step of the sequence in order, not just the end result
- Draw and label a diagram if the question invites one, it can substitute for written text
- Use the correct geographical terms (arete, corrie, rock lip, tarn) throughout
What is the name for the small lake that forms in the floor of a corrie after glaciation?
This question always wants the SEQUENCE of formation, not just the finished landform. Practise explaining each stage in order, using the right process names.
Practise glacial landform formation“Whenever a student answers Question 3 (Coasts), it closes with a 6 mark question judging the costs, benefits or effectiveness of coastal management strategies, always using a given figure.”
This question type recurs in 3 of the 4 sittings we have full papers for, covering soft engineering (June 2021), general coastal protection effectiveness (June 2022), and hard engineering (June 2023). June 2020's Question 3 closed with a 6 mark landform-formation question instead, covered in a separate cluster.
1×asked“Discuss the costs and benefits of soft engineering strategies in protecting coastlines. Use Figure 10 and Figure 11 and your own understanding.”
“Discuss the costs and benefits of soft engineering strategies in protecting coastlines. Use Figure 10 and Figure 11 and your own understanding.”
What it’s really asking
Discuss both a real cost AND a real benefit of at least two soft engineering strategies (beach nourishment, dune regeneration), using the two photographs given.
What the sources actually showed — June 2021
A photograph illustrating beach nourishment, where new sand or shingle is added to a beach.
A photograph illustrating dune regeneration, where sand dunes are restored or protected, for example using marram grass planting or fencing.
The full worked answer — June 2021
Beach nourishment, shown in Figure 10, replaces beach material removed by erosion or longshore drift, and its main benefit is that a wider beach acts as a natural buffer against both erosion and coastal flooding while also creating a more attractive amenity for tourism at a relatively low cost. The main cost, though, is that it requires constant maintenance since the added material simply washes away again, especially after winter storms, at a cost that can reach up to £500,000 per 100 metres.
Dune regeneration, shown in Figure 11, similarly benefits the coastline by absorbing wave energy naturally and increasing biodiversity by creating habitats for plants, animals and birds, at a lower typical cost of £400 to £2000 per 100 metres. However, newly planted dunes can be easily damaged by storms and take time to establish, sometimes deterring tourists from the area while the grass is being planted and protected. Overall, soft engineering works with natural coastal processes rather than against them and can improve the environment, but its lower cost comes with the trade-off of needing far more frequent upkeep than a hard engineering structure.
Could you have written this? Every fact in this answer is drilled in our quizzes — the writing is the easy part once the evidence is automatic.
Practise coastal management questionsWhat the mark scheme rewarded
- Thorough understanding of the costs and benefits of at least two soft engineering strategies, applied to Figures 10 and 11 with real cost figures
- Beach nourishment can cost up to £500,000 per 100 metres and needs constant maintenance
- Dune regeneration costs £400 to £2000 per 100 metres but is easily storm-damaged while establishing
Traps examiners saw
- Discussing only one soft engineering strategy, which caps the answer at Level 2
- Discussing hard engineering strategies instead, which earns no credit here
Full-mark self-check 0 of 2
1×asked“Assess the effectiveness of strategies used to protect coastlines against erosion. Use Figure 13 and your own understanding.”
“Assess the effectiveness of strategies used to protect coastlines against erosion. Use Figure 13 and your own understanding.”
What it’s really asking
Judge how well the groynes, rock armour and cliff regrading shown in the diagram actually protect the coastline, including noting where the diagram shows a strategy is NOT fully working.
What the sources actually showed — June 2022
A diagram showing coastal management strategies and processes: a north groyne and south groyne trapping beach material, rock armour, a regraded cliff, recent slumping, and cliff collapse downdrift of the south groyne.
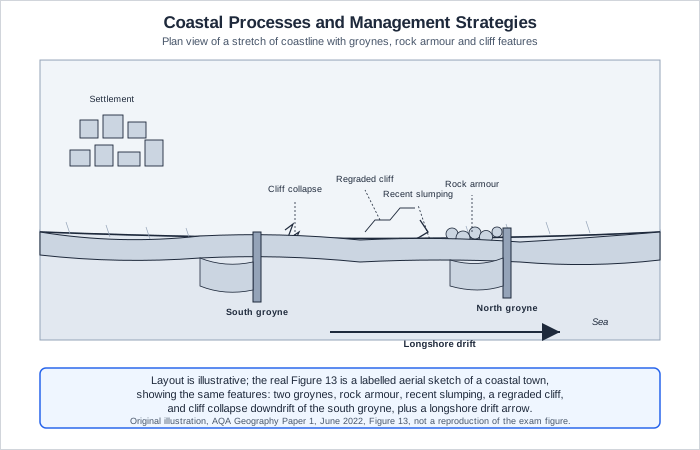
The full worked answer — June 2022
Figure 13's two groynes are designed to trap sand moving along the beach by longshore drift, building up a wider beach on the updrift side that acts as a buffer against wave attack and protects the cliffs behind it, while also creating a beach that is popular with tourists. However, the diagram itself shows the strategy is only partly effective, since immediately downdrift of the south groyne the cliffs are shown collapsing, because that stretch of coast has been starved of the beach material the groyne is now trapping elsewhere.
The rock armour and regraded cliff shown in the same diagram add further protection, since rock armour disperses wave energy at the base of the cliff while regrading reduces the cliff's slope angle to increase its stability, yet the diagram also shows recent slumping still occurring even with these defences in place. This shows that combining several hard engineering strategies together increases protection but does not eliminate the risk of further movement, so overall these strategies are moderately effective at protecting the cliffs directly in front of them, while genuinely increasing erosion risk further along the coast.
Could you have written this? Every fact in this answer is drilled in our quizzes — the writing is the easy part once the evidence is automatic.
Practise coastal management questionsWhat the mark scheme rewarded
- Thorough understanding of at least two strategies shown in Figure 13, with a reasoned assessment of their effectiveness including any limitations shown in the diagram itself
- Groynes trap beach material updrift but the diagram shows cliff collapse downdrift of the south groyne
- Rock armour and cliff regrading add protection, but the diagram still shows recent slumping
Traps examiners saw
- Describing the strategies shown without ever assessing how effective they really are
- Ignoring the diagram's own evidence of collapse or slumping, which is needed to reach Level 3
Full-mark self-check 0 of 2
1×asked“Discuss the costs and benefits of hard engineering strategies for coastal management. Use Figure 13 and your own understanding.”
“Discuss the costs and benefits of hard engineering strategies for coastal management. Use Figure 13 and your own understanding.”
What it’s really asking
Discuss a real cost AND a real benefit for at least two hard engineering strategies shown in the photograph of Withernsea's coastal defences.
What the sources actually showed — June 2023
A photograph of coastal defences at Withernsea in eastern England, showing hard engineering structures protecting the coastline.
The full worked answer — June 2023
Sea walls, of the kind shown protecting Withernsea in Figure 13, benefit the coast by deflecting wave energy straight back out to sea and acting as a barrier against flooding, giving residents a strong sense of security, and their promenade often doubles as a public walkway. The cost, though, is that sea walls are very expensive to build and maintain, over £5000 per metre, and reflected waves can scour away the beach in front of them, eventually undermining the wall's own foundations.
Rock armour, also visible in this kind of coastal defence, benefits the coast by dispersing wave energy cheaply and is quick to build and easy to maintain compared with a sea wall, but its cost is that it makes the beach difficult and unattractive to access, since people have to climb over the large rocks, and importing the rock itself can be expensive. Overall, hard engineering structures like these are highly effective at protecting the specific stretch of coastline they defend, but at a high financial cost, and they can also make other stretches of coast worse off by disrupting the natural movement of sediment.
Could you have written this? Every fact in this answer is drilled in our quizzes — the writing is the easy part once the evidence is automatic.
Practise coastal management questionsWhat the mark scheme rewarded
- Thorough understanding of the costs and benefits of at least two hard engineering strategies shown in Figure 13, with real facts rather than generic statements
- Sea walls cost over £5000 per metre and can be undermined by reflected wave scour
- Rock armour is cheaper and quick to build, but makes beach access difficult and can be expensive to import
Traps examiners saw
- Discussing only one hard engineering strategy, which caps the answer at Level 2
- Discussing soft engineering strategies instead, which earns no credit for this question
Full-mark self-check 0 of 2
The method for every Q03.6 / Q03.7 / Q03.6 — same every sittingMark bands, steps, timing
What this question type rewards
The topic changes by sitting — the mark scheme never does. Learn this once, then open your question above for that sitting’s sources and a full worked answer.
- Covering at least two named strategies, not just one
- Discussing a real cost AND a real benefit for each strategy, with specific figures where possible
- Reaching an explicit overall judgement about effectiveness or the balance of costs and benefits
The steps
- Identify whether the question wants hard, soft, or general coastal management strategies
- Cover at least two named strategies from the figure
- Give a real cost figure and a real benefit for each
- Reach an explicit overall judgement, weighing effectiveness against cost or wider coastal impact
Which of the following best describes a destructive wave?
Learn real cost figures for groynes, sea walls, rock armour, beach nourishment and dune regeneration, so you can back up every judgement with a genuine number.
Practise coastal management questions“Whenever a student answers Question 4 (Rivers), it closes with a 6 mark question on flood risk or flood management, always using a given figure or factfile.”
This 6 mark river flood question recurs in all 4 sittings we have full papers for, though the exact focus shifts between the physical/human causes of flood risk (June 2020), the impacts of management strategies (June 2021), the benefits of hard versus soft engineering (June 2022), and the issues arising from a named scheme (June 2023).
1×asked“Explain how physical and human factors may affect flood risk. Use Figure 19 and your own understanding.”
“Explain how physical and human factors may affect flood risk. Use Figure 19 and your own understanding.”
What it’s really asking
Explain at least one physical factor AND one human factor affecting flood risk, applying both directly to the real Cockermouth/Storm Desmond data given.
What the sources actually showed — June 2020
A factfile on Cockermouth and the impact of Storm Desmond in December 2015: 340 millimetres of rain fell in 24 hours; Cockermouth sits at the confluence of two rivers; the surrounding landscape has steep hills; many homes and businesses are built on the floodplains of the local rivers.
The full worked answer — June 2020
Figure 19 shows a physical factor that greatly raised flood risk: 340 mm of rain falling in just 24 hours would rapidly saturate the soil, exceeding its infiltration capacity so that huge amounts of water flowed overland as surface runoff rather than soaking in. Cockermouth's location at the confluence of two rivers compounds this, since it means two separate drainage basins' worth of floodwater converge in the same place at once, while the steep surrounding hills further speed up how quickly that runoff reaches the town.
The human factor shown in Figure 19 is that many homes and businesses are built directly on the floodplain, where impermeable surfaces such as concrete cannot let water percolate into the ground, shortening the lag time between rainfall and the river's peak discharge and putting more property directly in the path of rising water. Because both the physical setting (confluence, steep hills, extreme rainfall) and the human decision to build on the floodplain acted together, Cockermouth's flood risk was a genuine combination of factors rather than any single cause alone.
Could you have written this? Every fact in this answer is drilled in our quizzes — the writing is the easy part once the evidence is automatic.
Practise river flood management questionsWhat the mark scheme rewarded
- Thorough understanding of at least one physical factor and one human factor affecting flood risk, both applied directly to the real Figure 19 data
- 340 mm of rain in 24 hours and a confluence location raised Cockermouth's flood risk
- Homes and businesses built on the floodplain, with impermeable surfaces, shortened the lag time to peak flood
Traps examiners saw
- Discussing only physical OR only human factors, which caps the answer at Level 2
- Never using the real figures from Figure 19, relying only on generic factors
Full-mark self-check 0 of 2
1×asked“Discuss how flood management strategies may have impacts on people and the environment. Use Figure 14 and an example you have studied.”
“Discuss how flood management strategies may have impacts on people and the environment. Use Figure 14 and an example you have studied.”
What it’s really asking
Discuss a real impact on people AND a real impact on the environment from at least one flood management strategy shown in the diagram, backed by a genuine named example.
What the sources actually showed — June 2021
A diagram of a river catchment showing flood management strategies: trees planted in the upland catchment area, flood defences including flood walls and embankments, and development of wetland areas and water meadows on the floodplain.
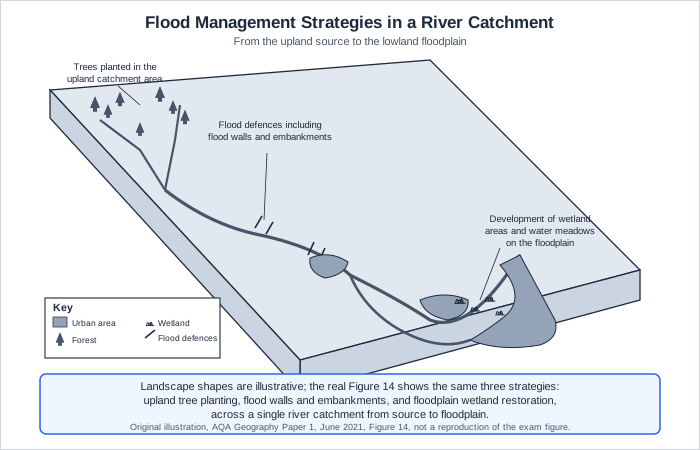
The full worked answer — June 2021
Planting trees in the upland catchment, shown in Figure 14, benefits the environment by increasing interception of rainfall, absorbing CO2 and creating habitats that increase biodiversity, while the Environment Agency estimates this can reduce flooding by as much as 20%, directly benefiting the people living downstream. However, this can mean a loss of potential farmland, which affects the people who previously earned a living from that upland area.
The River Quaggy restoration in Greenwich, a real example I have studied, shows this in practice: a river that had been diverted underground was brought back to the surface and restored close to its natural meandering course in 2007, with wildflower meadows and tree avenues planted along it. This brought real environmental benefits and gave local people new green recreational space, although residents also had to accept that some flooding in the restored area may occasionally occur, showing that even a strategy designed to benefit both people and the environment involves a genuine trade-off for the people living nearest to it.
Could you have written this? Every fact in this answer is drilled in our quizzes — the writing is the easy part once the evidence is automatic.
Practise river flood management questionsWhat the mark scheme rewarded
- Thorough understanding of the impacts of at least one flood management strategy on both people and the environment, supported by Figure 14 and a genuine named example
- The Environment Agency estimates tree planting can reduce flooding by up to 20%
- The River Quaggy restoration in Greenwich (2007) brought environmental and recreational benefits, with some accepted flood risk
Traps examiners saw
- Discussing impacts on only people or only the environment, which caps the answer at Level 2
- Giving no named example at all, which limits the answer below the top of Level 2
Full-mark self-check 0 of 2
1×asked“Assess the benefits of using hard engineering and soft engineering to reduce the risk of river flooding. Use Figure 16 and your own understanding.”
“Assess the benefits of using hard engineering and soft engineering to reduce the risk of river flooding. Use Figure 16 and your own understanding.”
What it’s really asking
Assess a real benefit of hard engineering AND a real benefit of soft engineering for reducing flood risk, weighing the two viewpoints given in the figure against each other.
What the sources actually showed — June 2022
Two contrasting opinions: a local resident living on a floodplain who wants government-funded hard engineering such as dams and flood walls, and an Environment Officer who argues soft engineering such as tree planting and river restoration is kinder to the environment and cheaper while still reducing flood risk.
The full worked answer — June 2022
The local resident's view in Figure 16 has real merit: hard engineering such as dams and floodwalls physically holds back and controls floodwater very effectively, offering the strongest, most reliable protection for expensive property on a floodplain, even though individual projects can cost several million pounds. Reservoirs specifically also generate hydroelectric power and provide a drinking water supply alongside their flood protection benefit, adding real economic value beyond just flood control.
The Environment Officer's view also carries real weight, since soft engineering strategies like tree planting genuinely reduce flooding while costing far less to implement and maintain, and, unlike hard engineering, they work with natural river processes rather than disrupting the wider ecosystem. Weighing both views, I judge hard engineering offers the strongest guaranteed protection where property value is very high, but soft engineering delivers most of the same flood-risk reduction far more cheaply and sustainably in less densely built-up catchments, so the right choice genuinely depends on what is being protected.
Could you have written this? Every fact in this answer is drilled in our quizzes — the writing is the easy part once the evidence is automatic.
Practise river flood management questionsWhat the mark scheme rewarded
- Thorough understanding of a real benefit of hard engineering AND a real benefit of soft engineering, applied to both viewpoints in Figure 16, with a reasoned assessment
- Hard engineering (dams, flood walls) offers reliable protection but can cost several million pounds per project
- Soft engineering (tree planting, river restoration) is cheaper and works with natural processes
Traps examiners saw
- Assessing only hard OR only soft engineering, which caps the answer at Level 2
- Ignoring Figure 16's two contrasting viewpoints entirely
Full-mark self-check 0 of 3
1×asked“Discuss the issues which can arise from flood management schemes. Use Figure 16 and your own understanding.”
“Discuss the issues which can arise from flood management schemes. Use Figure 16 and your own understanding.”
What it’s really asking
Discuss a positive issue AND a negative issue that can come from a flood management scheme, applying the given River Thames flood-channel case directly.
What the sources actually showed — June 2023
A website extract describing a new flood relief channel proposed for the River Thames between Datchet and Teddington: it would protect 15,000 homes and 2,400 businesses, create 250 hectares of new wildlife habitat, and provide new recreational opportunities including walking, cycling, boating and angling, at an estimated flood damage cost of around £1 billion which could double by 2055 due to climate change.
The full worked answer — June 2023
The positive issues from the Thames flood relief channel described in Figure 16 are substantial: protecting 15,000 homes and 2,400 businesses directly reduces the £1 billion of flood damage the area currently risks, a cost that could double by 2055 due to climate change if nothing is done, while the scheme's 250 hectares of new habitat and new recreational opportunities like cycling and angling bring real environmental and social benefits alongside the flood protection itself.
However, schemes of this scale bring real negative issues too, since building a new flood channel is extremely expensive and disruptive for people living nearby during construction, and creating a fast new channel for floodwater in one area can potentially increase flood risk further downstream where that water eventually has to go. There is also disturbance to existing habitats during construction, and some flood relief channels are criticised for looking unnatural, so while the Thames scheme brings genuine benefits, these come with real construction costs, disruption, and a risk of simply moving the flooding problem elsewhere.
Could you have written this? Every fact in this answer is drilled in our quizzes — the writing is the easy part once the evidence is automatic.
Practise river flood management questionsWhat the mark scheme rewarded
- Thorough understanding of both positive and negative issues from a flood management scheme, applied directly to the real figures given in Figure 16
- The Thames scheme would protect 15,000 homes and 2,400 businesses and create 250 hectares of new habitat
- Large flood relief channels are costly, disruptive to build, and can increase flood risk further downstream
Traps examiners saw
- Discussing only the positive issues listed in Figure 16 with no negative issue at all, which caps the answer at Level 2
- Copying Figure 16's own wording without any independent development
Full-mark self-check 0 of 2
The method for every Q04.6 / Q04.6 / Q04.7 / Q04.6 — same every sittingMark bands, steps, timing
What this question type rewards
The topic changes by sitting — the mark scheme never does. Learn this once, then open your question above for that sitting’s sources and a full worked answer.
- Covering both sides of the question (physical and human, or positive and negative), not just one
- Applying real figures from the source directly, not describing it generically
- Bringing in a genuine named example where the question allows or requires one
The steps
- Identify which two sides the question wants (physical/human, hard/soft, positive/negative)
- Apply a real figure or fact from the source to each side
- Bring in a genuine named example if the question allows it
- Reach a reasoned conclusion where the command word (assess, discuss) expects one
Which of the following best describes the erosion process of abrasion?
This question always wants both sides developed with real figures, not a one-sided list. Practise a real named flood management example in depth.
Practise river flood management questions“Whenever a student answers Question 5 (Glacial), it closes with a 6 mark question on tourism, development or conservation in glaciated upland areas, always using a given figure and an example.”
This question type recurs in 3 of the 4 sittings we have full papers for, covering the success of tourism management strategies (June 2021), the economic and environmental impacts of tourism (June 2022), and the conflict between development and conservation (June 2023). June 2020's Question 5 closed with a 6 mark landform-formation question instead, covered in a separate cluster.
1×asked“Discuss the success of strategies used to manage the impacts of tourism in glaciated upland areas. Use Figure 17 and an example you have studied.”
“Discuss the success of strategies used to manage the impacts of tourism in glaciated upland areas. Use Figure 17 and an example you have studied.”
What it’s really asking
Discuss how well at least one real management strategy actually works to reduce a tourism problem in a glaciated upland area, using the Snowdon Sherpa bus service and a genuine case study.
What the sources actually showed — June 2021
A description of the Snowdon Sherpa, a bus service linking the six main routes up Mount Snowdon, along with the main car parks, villages and tourist attractions in the area.
The full worked answer — June 2021
The Snowdon Sherpa bus service, described in Figure 17, manages traffic congestion by connecting the main car parks, villages and walking routes up Snowdon, so tourists can park once and use the bus to reach different starting points rather than driving between them, which reduces congestion, carbon emissions and pressure on narrow mountain roads.
In the Lake District, a real example I have studied, the Go Lakes Travel scheme has introduced pay-as-you-go bikes to cut car use, while Ambleside now has Controlled Parking Zones limiting town centre parking to one hour, and severely eroded paths at Tarn Hows have been covered with soil, reseeded and gravelled to protect them. These strategies have been genuinely successful in reducing some pressure, but the sheer growth in visitor numbers each year means footpath erosion and traffic congestion remain constant problems requiring ongoing maintenance, so I judge these strategies are only partially, not fully, successful.
Could you have written this? Every fact in this answer is drilled in our quizzes — the writing is the easy part once the evidence is automatic.
Practise glaciated tourism and conservation questionsWhat the mark scheme rewarded
- Thorough understanding of at least one strategy managing tourism impacts, applied to Figure 17 and a genuine named example, with an assessment of how successful it really is
- The Snowdon Sherpa bus links car parks, villages and walking routes to cut congestion
- The Lake District's Go Lakes Travel scheme and Tarn Hows path restoration show real but only partial success
Traps examiners saw
- Describing a strategy without ever judging how successful it actually is
- Giving no named example at all, which limits the answer below the top of Level 2
Full-mark self-check 0 of 3
1×asked“Assess the economic and environmental impacts of tourism in a glaciated upland area of the UK. Use Figure 20 and your own understanding.”
“Assess the economic and environmental impacts of tourism in a glaciated upland area of the UK. Use Figure 20 and your own understanding.”
What it’s really asking
Assess a real economic impact AND a real environmental impact of tourism in a glaciated area, using the real Snowdonia visitor statistics given.
What the sources actually showed — June 2022
Visitor statistics for Snowdonia National Park: 3.89 million visitors in 2015, rising from 2013 to 2015; 2.43 million day visitors and 1.46 million staying visitors; an average spend of £122 per visitor, the second highest of all UK National Parks; and 595,000 visitors to Snowdon itself annually.
The full worked answer — June 2022
The economic impact shown in Figure 20 is substantial: with 3.89 million visitors in 2015 spending an average of £122 each, the second highest of any UK National Park, this spending supports local shops, cafes, hotels and transport businesses, and with 1.46 million staying visitors paying for overnight accommodation, tourism clearly provides significant income and employment for the local economy.
The environmental impact is more damaging, since 595,000 visitors to Snowdon alone each year puts huge pressure on footpaths, causing erosion and trampling of vegetation, while increased traffic brings congestion and pollution to narrow mountain roads and disturbs farm animals and wildlife. Weighing both, I judge the economic benefits to local businesses are real and substantial, but so is the environmental cost of footpath erosion and habitat disturbance, so tourism in Snowdonia genuinely brings both significant advantages and significant environmental damage rather than one clearly outweighing the other.
Could you have written this? Every fact in this answer is drilled in our quizzes — the writing is the easy part once the evidence is automatic.
Practise glaciated tourism and conservation questionsWhat the mark scheme rewarded
- Thorough understanding of both the economic and environmental impacts of tourism, applied to the real statistics in Figure 20, with a balanced assessment
- 3.89 million visitors in 2015 spent an average of £122 each, the second highest of any UK National Park
- 595,000 annual visitors to Snowdon alone contribute to serious footpath erosion
Traps examiners saw
- Assessing only the economic OR only the environmental impact, which caps the answer at Level 2
- Ignoring the real figures in Figure 20 and writing only in generalities
Full-mark self-check 0 of 2
1×asked“Discuss the possible conflict between development and conservation in glaciated areas. Use Figure 19 and your own understanding.”
“Discuss the possible conflict between development and conservation in glaciated areas. Use Figure 19 and your own understanding.”
What it’s really asking
Discuss how a real land-use development (like the zip wire proposal) creates a genuine conflict with conservation goals in a glaciated area, covering both sides of the disagreement.
What the sources actually showed — June 2023
A newspaper extract about a proposed zip wire across the Thirlmere Valley in the Lake District in 2018, noting concerns that it will spoil the view and bring extra traffic to narrow roads, alongside a photograph of a zip wire attraction in North Wales.
The full worked answer — June 2023
The zip wire proposal described in Figure 19 shows a real conflict: tourism developments like this create valuable jobs and income for a rural glaciated area, but as the newspaper article itself states, local people are concerned it will spoil the view and bring extra traffic onto narrow roads, directly disturbing wildlife and the landscape that draws visitors to the area in the first place.
This tension is not unique to zip wires: quarrying for rock like slate or granite in glaciated areas creates jobs but brings noise, heavy traffic and dust that can destroy habitats and become a visual eyesore, while farming and forestry boost the rural economy but can also reduce biodiversity through habitat loss. However, revenue from development, especially tourism, can genuinely be reinvested into conservation projects, so I judge the conflict is real but not always a straightforward trade-off, since well managed development can sometimes fund the very conservation it appears to threaten.
Could you have written this? Every fact in this answer is drilled in our quizzes — the writing is the easy part once the evidence is automatic.
Practise glaciated tourism and conservation questionsWhat the mark scheme rewarded
- Thorough understanding of the conflict between at least one land use and conservation, applied to Figure 19, with reasoned discussion of both sides
- The zip wire proposal's own critics cite spoiling the view and extra traffic on narrow roads
- Quarrying and farming show the same development-versus-conservation tension across different land uses
Traps examiners saw
- Discussing the zip wire only, with no reference to any other land use showing the same pattern
- Describing only development or only conservation, with no real sense of conflict between the two
Full-mark self-check 0 of 2
The method for every Q05.6 / Q05.7 / Q05.6 — same every sittingMark bands, steps, timing
What this question type rewards
The topic changes by sitting — the mark scheme never does. Learn this once, then open your question above for that sitting’s sources and a full worked answer.
- Applying real figures or quotes from the source directly, not describing it generically
- Bringing in a genuine named example (a real National Park, a real scheme) where required
- Reaching an explicit judgement on success, impact, or the balance of the conflict
The steps
- Identify exactly what the question wants assessed (success, impact, or conflict)
- Apply a real figure or quote from the source directly
- Bring in a genuine named example (a real National Park or scheme) where the question requires one
- Reach an explicit, reasoned judgement rather than just a description
What is the name for the small lake that forms in the floor of a corrie after glaciation?
Learn one real UK glaciated area in depth, such as the Lake District or Snowdonia, with genuine visitor numbers and management schemes ready to deploy.
Practise glaciated tourism and conservation questionsWhat is guaranteed to come up, and what genuinely varies
Across the four sittings we have full papers for, Paper 1's overall structure never changed, but the exact topic tested within several recurring slots shifts noticeably between sittings.
Not seen as a standalone question type in the four sittings we have full papers for
A standalone question purely on the population or economic characteristics of hot deserts or cold environments, beyond the case-study questions covered here · A dedicated question on the formation of a delta or estuary landform, though estuary characteristics were tested as a short descriptive question · A standalone question on the mechanics of longshore drift alone, separate from a spit, bar or beach-management question
These are named on the AQA specification and could still appear, but did not carry their own separate question in any of the four sittings we analysed, so do not build your whole revision plan around them.
Before you revise
Does Paper 1 have the same structure every year?
Yes, more consistently than Paper 2. Every sitting we have full papers for opens with Section A (The challenge of natural hazards, 33 marks, all compulsory), moves to Section B (The living world, 25 marks, all compulsory), and closes with Section C (Physical landscapes in the UK), where you answer two of Question 3 (Coasts), Question 4 (Rivers) or Question 5 (Glacial), each worth 15 marks. All four sittings we analysed totalled 88 marks in 1 hour 30 minutes, with no genuine structural exception like Paper 2's June 2022. Always check your own paper's front cover to confirm, since AQA can make real changes in any future series.
Do I need to bring anything special into this exam?
Yes. The paper's own instructions list a pencil, a rubber, a ruler and a calculator as required materials in every sitting we checked. June 2021 and June 2023 also required an Ordnance Survey map key insert, since real 1:50,000 or 1:25,000 OS map extracts were used in Section C that year. June 2020 and June 2022 needed no separate OS insert, since those sittings used custom-drawn maps and diagrams in Section C instead of real OS extracts. Forgetting a ruler or calculator costs accuracy marks on measurement and calculation questions that have nothing to do with your geographical knowledge.
Which two of Coasts, Rivers and Glacial should I revise for Section C?
The exam only requires two of the three, but the recurring question SHAPES are near identical across all three options, a short map or photograph skills question, a 4 mark 'explain the formation of a landform' question, and a closing 6 mark judgement on management, tourism or flood risk. Because the shape repeats, revising all three properly is not much harder than revising two, and it protects you if one option's specific stimulus material on the day is unfamiliar. If you do only prepare two, make sure you have real named examples ready for both the landform formation questions and the management judgement questions in each.
How much of the closing judgement questions is about the figure versus my own knowledge?
Both matter, but every mark scheme we reviewed explicitly rewards specific use of the given figure, not an answer written entirely from memory. An answer that ignores the source and relies purely on general knowledge is capped at a lower level even when the geography in it is accurate, so always name a real detail, number or quote from the source you are told to use, then add your own case study or understanding on top.
What is the single biggest way marks are lost on this paper?
According to the real mark schemes for these sittings, students very often identify the right idea, a correct process, a real management strategy, but do not develop it far enough for the second, third or fourth mark, or never explain WHY or HOW something happens, only WHAT happens. On the 'explain the formation of' questions in particular, naming the correct landform without explaining the actual sequence of processes that created it repeatedly capped answers at Level 1 across every sitting we reviewed.
Practise the questions that are guaranteed to come up
Every question type on this page has practice questions waiting in the app, built the way AQA actually structures Paper 1.
Start revising free