Test yourself on Climate Change and Hazard Response with exam style questions, marked instantly.
Flashcards that come back just before you would forget them.
A revision plan that remembers what you know and shows what to do next.
See which topics you have nailed and which need another look.
Quiz yourself on Climate Change and Hazard ResponseGet your flashcardsBuild my revision planTrack my progress🌡️ The Summer That Changed the Conversation
The scientists were not surprised. They had been predicting exactly this kind of acceleration for decades. What made 2023 different was not the heat itself — it was the fact that 1.45°C of warming above pre-industrial levels was now measurable in real time, not projected in a model. The planet's atmosphere contained 421 parts per million of CO₂ — the highest concentration in at least 3 million years, since long before modern humans existed.
Climate change is not a future threat. It is the present reality. Understanding its causes, its evidence, and the contrasting ways societies are responding to it is one of the most important and complex topics in GCSE Geography — and one that rewards students who bring precision, not just passion, to their answers.
🔍 Evidence That Climate Is Changing
One of the most important things to understand about climate change is that scientists do not rely on a single line of evidence. If only temperature records existed, there would be room for doubt — instruments might be poorly placed, records might be incomplete. But climate scientists have assembled multiple independent lines of evidence, each measuring something completely different, and they all tell the same story. This convergence of evidence across different fields and methods is why the scientific consensus on climate change is so strong.
1. Temperature Records
The global average surface temperature has risen approximately 1.2°C above pre-industrial levels (the 1850–1900 baseline) by 2023. The ten hottest years on record have all occurred since 2010. The year 2023 was the hottest single year ever recorded at 1.45°C above the pre-industrial baseline. These measurements come from thousands of weather stations on land and thousands of ocean buoys, independently operated by different national agencies — making coordinated error or fraud essentially impossible.
2. Ice Cores
Ice cores drilled from the Antarctic and Greenland ice sheets provide the most direct window into Earth's ancient climate. Layers of ice form each year like tree rings, trapping tiny air bubbles containing samples of the atmosphere at the time. Scientists can drill down and extract air from 800,000 years ago. These records show that CO₂ concentrations have fluctuated between roughly 180 ppm (ice ages) and 280 ppm (warm interglacials) over the past 800,000 years — and that temperature closely tracks CO₂ throughout. Since industrialisation, CO₂ has risen to 421 ppm in 2023 — a level not seen for at least 3 million years, far outside the natural range of variation. The rate of increase is also unprecedented: CO₂ is rising about 100 times faster than at the end of the last ice age.
3. Sea Level Rise
Global sea levels have risen by approximately 21–24 cm since 1880. The rate of rise has accelerated markedly: satellite data since 1993 shows a current rate of 3.7 mm per year, roughly double the average rate of the 20th century. Sea level rises for two interconnected reasons: thermal expansion (warmer water physically expands and takes up more volume) and melting ice (glaciers, the Greenland ice sheet, and parts of the Antarctic ice sheet are adding water to the ocean). The Greenland ice sheet alone contains enough water to raise global sea levels by approximately 7 metres if it melted entirely.
4. Glacier Retreat
Glaciers worldwide are retreating at accelerating rates. The Rhône Glacier in Switzerland lost 1.4 km in length in just 20 years (2000–2020) and has retreated more than 3 km since records began. Arctic sea ice extent has declined by roughly 13% per decade since satellite monitoring began in 1979; Arctic summer sea ice has lost approximately 40% of its area. The Himalayan glaciers — which supply freshwater to over a billion people across South Asia — are losing mass faster than almost anywhere else on Earth. The IPCC projects that two-thirds of Himalayan glacier volume could be lost by 2100 under high-emissions scenarios.
5. Shifting Seasons and Phenological Changes
Phenology — the study of seasonal biological events such as flowering, migration and hibernation — provides a biological record of warming. In the United Kingdom, spring is arriving approximately 26 days earlier than in the 1980s, based on records of first flowering dates kept by amateur recorders over centuries. Migratory bird species are arriving earlier and departing later. In the ocean, species distributions are shifting poleward as water temperatures rise.
6. Coral Bleaching
Coral reefs are among the most temperature-sensitive ecosystems on Earth. When water temperatures rise just 1–2°C above the normal summer maximum, corals expel the symbiotic algae (zooxanthellae) that give them colour and provide up to 90% of their energy — a process called bleaching. If temperatures remain elevated, corals starve and die. The Great Barrier Reef experienced four mass bleaching events between 2016 and 2024, with over 50% of the reef bleached in 2022 — a frequency that gives individual reefs no time to recover between events.
Quick Check: Give three different types of evidence that Earth's climate is changing. For each, state one specific statistic.
Accept any three of the following (one statistic each): Temperature records — 2023 was 1.45°C above pre-industrial baseline; hottest year on record. Ice cores — CO₂ is now 421 ppm, highest in 3 million years; 100× faster than natural post-ice-age rise. Sea level rise — 21–24 cm since 1880; currently rising at 3.7 mm/year. Glacier retreat — Rhône Glacier lost 1.4 km in 20 years; Arctic sea ice down 13% per decade. Phenology — UK spring arriving 26 days earlier than 1980s. Coral bleaching — Great Barrier Reef had 4 mass bleaching events 2016–2024.
🌍 Natural vs Human Causes of Climate Change
A critical point for the exam: climate has always changed naturally. The Earth has experienced ice ages and warm periods throughout its 4.5-billion-year history — long before humans existed. You must know the natural causes of climate change for the exam. However, natural causes cannot explain the current rate or pattern of warming. The current phase of warming is happening far faster than any natural process can account for, and the scientific evidence — summarised in the IPCC Sixth Assessment Report (2021) — concludes with "unequivocal" certainty that human influence is the dominant cause of warming since 1950.
Natural Causes
The Earth's orbit around the Sun is not perfectly circular. It varies between more elliptical and more circular on approximately a 100,000-year cycle. The tilt of Earth's axis also varies slightly over a 41,000-year cycle, and the axis "wobbles" on a 26,000-year cycle. Together, these orbital variations — called Milankovitch cycles — alter how much solar radiation reaches different parts of Earth at different times of year. Over tens of thousands of years, these cycles drive ice ages and warm interglacial periods. They are well understood and clearly visible in ice core records. However, Milankovitch cycles operate far too slowly to explain modern warming — they produce changes over millennia, not decades.
Major volcanic eruptions inject large quantities of sulphur dioxide (SO₂) into the stratosphere. Here, SO₂ reacts with water to form tiny sulphate particles that reflect incoming solar radiation back into space, temporarily cooling the planet. The eruption of Mount Pinatubo in the Philippines in 1991 reduced global average temperatures by approximately 0.5°C for 1–2 years. Importantly, volcanic eruptions cause cooling, not warming — so they cannot explain modern temperature rises. They are also temporary: once the sulphate particles settle out of the stratosphere (within 1–3 years), temperatures return to previous levels.
The Sun's energy output is not perfectly constant. It varies in an approximately 11-year cycle linked to sunspot activity, with small increases in radiation during solar maximum periods. Over longer timescales, solar output has also varied. However, solar output has actually shown a slight cooling trend since the 1980s — the opposite of what would be expected if the Sun were driving modern warming. Scientists can detect this directly via satellite measurements. Solar variation accounts for less than 10% of the observed warming since 1950.
Human Causes
Human causes have dominated the warming signal since approximately 1950, and are almost entirely responsible for warming since the 1970s. They work by increasing the concentration of greenhouse gases in the atmosphere, enhancing the natural greenhouse effect.
Coal, oil and natural gas are formed from organic material buried millions of years ago. When burned for energy (electricity generation, heating, transport), they release carbon that has been locked underground for millions of years as CO₂. In 2022, the world emitted approximately 38 billion tonnes of CO₂ from fossil fuel burning — the highest annual total in human history. The industrial revolution, which began around 1750 in Britain and spread globally through the 19th and 20th centuries, is the starting point for the rapid rise in atmospheric CO₂.
Forests store enormous quantities of carbon in their biomass (wood, leaves, roots) and in the soil. When trees are felled and burned to clear land for agriculture or settlement, that stored carbon is released as CO₂. Deforestation also removes the tree's capacity to absorb CO₂ in the future through photosynthesis — destroying both a carbon store and a carbon sink simultaneously. Deforestation currently accounts for approximately 15% of annual global CO₂ emissions. The Amazon rainforest has lost approximately 20% of its original area since 1970, partly converting from a net carbon sink to a net carbon source in heavily deforested areas.
Agriculture contributes greenhouse gas emissions through several pathways. Livestock — particularly cattle, sheep and goats — produce methane (CH₄) during digestion (enteric fermentation). Methane is approximately 28 times more potent as a greenhouse gas than CO₂ over a 100-year period (and about 80 times more potent over 20 years). Globally, there are approximately 1 billion cattle. Rice paddies produce methane as organic matter decomposes in flooded, oxygen-poor conditions. Nitrogen fertilisers release nitrous oxide (N₂O) — approximately 265 times more potent than CO₂ over 100 years — when broken down in soil by bacteria. Together, these agricultural sources account for roughly 10% of global greenhouse gas emissions.
Beyond energy use, several industrial processes release CO₂ directly. Cement production — the world's most widely used building material — involves heating limestone (calcium carbonate), which releases CO₂ as a by-product. Globally, cement production accounts for approximately 8% of annual CO₂ emissions. Steel production, aluminium smelting and chemical manufacturing also contribute. These process emissions are distinct from the emissions from burning fossil fuels for energy and are harder to eliminate through simply switching to renewable electricity.
Transport accounts for approximately 16% of global greenhouse gas emissions. Road vehicles are the largest contributor, followed by aviation (which has an enhanced warming effect because emissions occur at high altitude) and shipping. Global aviation alone produces approximately 2–3% of CO₂ emissions, but its total climate forcing is higher when contrails and other effects are included. Transport emissions are growing in absolute terms as vehicle ownership and air travel expand in emerging economies.
Natural vs Human Causes — Key Comparisons
| Factor | Natural Causes | Human Causes |
|---|---|---|
| Speed of change | Over thousands to millions of years | Over decades — 100× faster than natural post-ice-age change |
| Direction | Both warming and cooling (volcanoes cool; orbital cycles drive both) | Consistently warming since ~1950 |
| IPCC attribution | Accounts for less than 10% of post-1950 warming | Dominant driver of all post-1950 warming ("unequivocal") |
| CO₂ signature | Natural CO₂ range: 180–280 ppm over 800,000 years | CO₂ now 421 ppm — 50% above natural maximum in 3 million years |
| Example | Milankovitch cycles: 20,000–100,000-year orbital shifts; Pinatubo 1991: 0.5°C cooling for 1–2 years | Fossil fuel burning: 38 billion tonnes CO₂/year; deforestation: 15% of emissions |
⚙️ The Enhanced Greenhouse Effect — The Mechanism
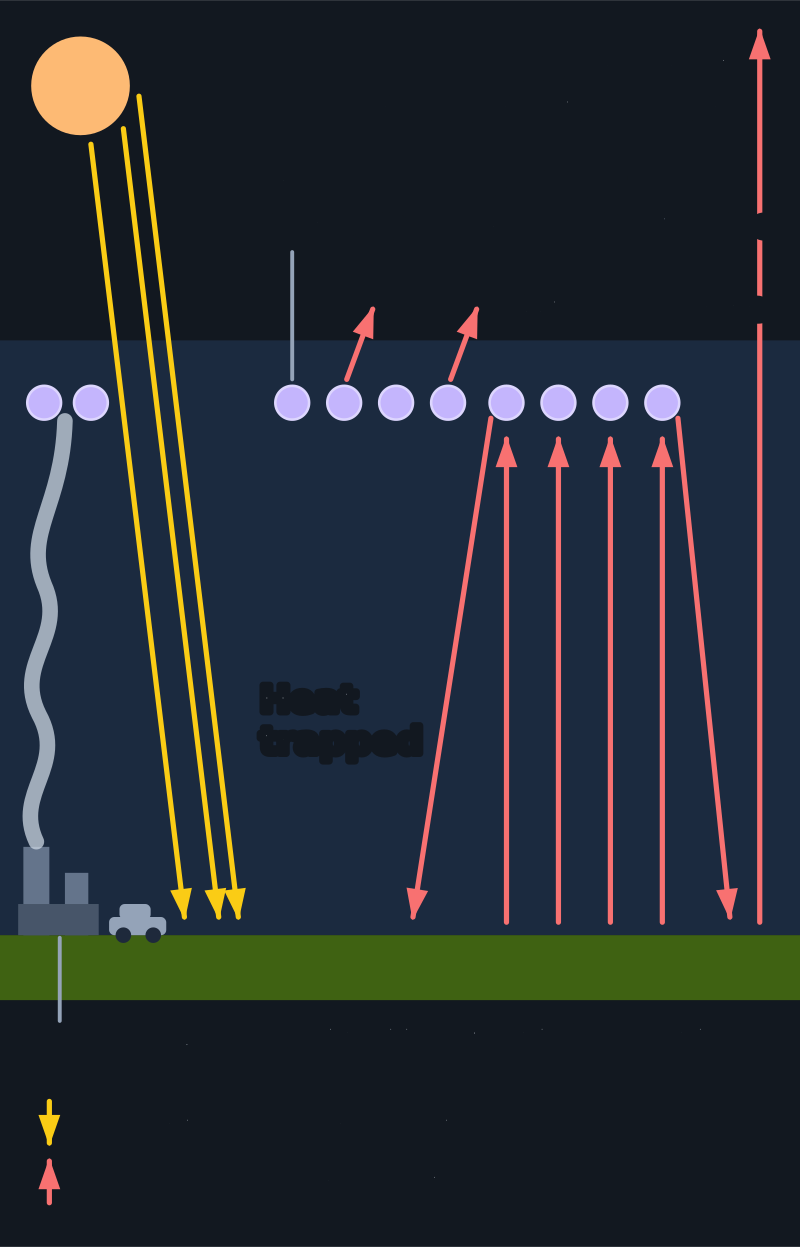
Figure 1: The Enhanced Greenhouse Effect. Human emissions of CO₂, methane and nitrous oxide trap more outgoing heat, raising global temperatures above natural levels.
Not to scale. Some long-wave radiation passes through to space. The rest is absorbed by greenhouse gases and sent back in all directions, including down to the surface.
To understand climate change, you must understand the distinction between the natural greenhouse effect and the enhanced greenhouse effect.
The Natural Greenhouse Effect
Without any greenhouse effect, Earth's average surface temperature would be approximately -18°C — far below freezing. The actual average is approximately +15°C. This difference of 33°C is entirely due to the natural greenhouse effect, which has existed throughout Earth's history and makes the planet habitable. Here is how it works:
The Enhanced Greenhouse Effect
Human activities — primarily burning fossil fuels and deforestation — have increased the concentration of greenhouse gases in the atmosphere far above their natural levels. More greenhouse gas molecules mean more infrared radiation is absorbed and re-radiated back to Earth. The planet's energy budget becomes unbalanced: more energy arrives from the Sun than can escape back to space. The result is a gradual build-up of heat in the Earth system — measured as rising surface temperatures, warming oceans, and melting ice.
Key Greenhouse Gases and Their Warming Potential
| Gas | Main Human Source | Global Warming Potential (vs CO₂ over 100 years) | Atmospheric lifetime |
|---|---|---|---|
| Carbon dioxide (CO₂) | Fossil fuel burning, deforestation, cement | 1 (baseline) | Hundreds to thousands of years |
| Methane (CH₄) | Livestock digestion, rice paddies, gas leaks, landfill | 28× | ~12 years (shorter but more potent) |
| Nitrous oxide (N₂O) | Nitrogen fertilisers, livestock manure | 265× | ~114 years |
| CFCs and HFCs | Refrigerants, aerosols (many now banned under Montreal Protocol) | 4,000–15,000× | Varies; decades to centuries |
The long atmospheric lifetime of CO₂ means that emissions today will continue to trap heat for centuries. Even if all human CO₂ emissions stopped tomorrow, the warming already "locked in" from past emissions would continue for decades. This is why early action on mitigation is so much more effective than waiting.
Quick Check: Explain the difference between the natural greenhouse effect and the enhanced greenhouse effect.
The natural greenhouse effect is the process by which greenhouse gases in the atmosphere — CO₂, methane, water vapour — absorb outgoing infrared (heat) radiation from Earth's surface and re-emit it in all directions, including back towards the surface. This keeps Earth approximately 33°C warmer than it would otherwise be, making the planet habitable. The enhanced greenhouse effect occurs when human activities — burning fossil fuels, deforestation, agriculture — increase the concentration of greenhouse gases above natural levels. Higher concentrations trap more outgoing heat, creating an energy imbalance where more energy enters the Earth system than escapes. This drives global warming. CO₂ has risen from 280 ppm pre-industrially to 421 ppm today, and the IPCC states with unequivocal certainty that this human-caused enhancement is the dominant driver of warming since 1950.
🌊 Effects of Climate Change
Climate change produces effects at every scale — from the melting of polar ice to changes in crop yields in individual farming communities. In the exam, you will gain higher marks by organising effects under clear headings and by connecting physical changes to their human consequences. The strongest answers recognise that physical and human effects are deeply linked: a rise in sea level is a physical change, but it becomes a human catastrophe when millions of people lose their homes and livelihoods.
Physical Effects
- Sea level rise — a slow-moving catastrophe: Global mean sea level has risen 21–24 cm since 1880 and is currently rising at 3.7 mm per year. Projections suggest a further 0.3–1 m by 2100 under current trajectories, with higher estimates possible if large ice sheet instabilities are triggered. Even modest rises threaten enormous populations: Bangladesh has approximately 17 million people living within 1 metre of sea level; the Maldives has an average land elevation of just 1.5 m above sea level; the Pacific island nation of Tuvalu is purchasing land in Fiji in anticipation of becoming uninhabitable. Coastal cities including Miami, Jakarta, Mumbai and Shanghai face growing flood risk.
- More intense storms: Tropical storms (hurricanes and typhoons) draw their energy from warm ocean water. As sea surface temperatures rise, the maximum potential intensity of tropical storms increases. While the total number of tropical storms may not change significantly, the proportion reaching the highest categories (4 and 5) is projected to increase. The 2017 Atlantic hurricane season — which included Harvey, Irma and Maria — caused approximately $300 billion in damage, part of a trend of rising economic losses from extreme weather.
- Drought and water stress: Climate change is projected to intensify the global water cycle — wet areas getting wetter, dry areas getting drier. The Mediterranean region (southern Europe, North Africa, Middle East) is one of the most drought-affected areas, with rainfall declining and temperatures rising significantly faster than the global average. California experienced its driest three-year period on record (2020–2022) before catastrophic flooding in 2023 — demonstrating how climate change increases the swings between extremes as well as the averages. The Sahel in sub-Saharan Africa faces increasingly severe and prolonged droughts, threatening food and water security for hundreds of millions of people.
- Flooding and extreme rainfall: While droughts increase in some regions, other areas face greater flood risk as a warmer atmosphere holds more water vapour and produces heavier rainfall events when it does rain. The UK experienced unprecedented flooding in 2020 (Storm Dennis) and 2021 (flooding in London's underground). Germany and Belgium experienced catastrophic flash flooding in July 2021, killing over 200 people in events that scientists attributed partly to climate change. Thawing permafrost in Arctic regions releases methane (a more potent greenhouse gas than CO₂), creating a positive feedback loop that accelerates warming.
- Ecosystem disruption: Coral bleaching has been described above. Polar bears require sea ice to hunt seals — declining Arctic sea ice is reducing their habitat. Phenological mismatches are emerging: some species are responding to warming by advancing their seasonal behaviour (e.g. plants flowering earlier), while other species in the same ecosystem are not, disrupting food webs. Species are migrating poleward and to higher altitudes as temperatures rise — but not all species can do so, and many face extinction.
Human and Economic Effects
- Food security: Crop yields are projected to decline in many tropical and subtropical regions as temperatures rise beyond optimal growing conditions. The IPCC projects that climate change could reduce crop yields for staple foods (wheat, rice, maize) by 2–6% per decade in a 2°C warming scenario. At the same time, some higher-latitude regions (Canada, Russia, Scandinavia) may see increased yields as temperatures warm. The net effect is an increase in global food insecurity, concentrated in the countries that are already most vulnerable.
- Human migration: The World Bank projects that climate change could force 216 million people to migrate internally within their own countries by 2050 in a business-as-usual scenario, as water stress, crop failures, sea level rise and coastal flooding make their home regions unliveable. This represents one of the largest forced migration events in human history — with profound implications for geopolitical stability, urban infrastructure and international relations.
- Health: Rising temperatures increase heat stress mortality directly; global heat-related deaths have increased significantly in the 21st century. Warmer temperatures are also expanding the range of vector-borne diseases: malaria (carried by Anopheles mosquitoes) is spreading to higher altitudes in East Africa and South Asia as temperatures permit mosquito survival. Dengue fever is expanding its range significantly. Air quality deteriorates in heat waves as ground-level ozone forms more readily.
- Economic damage: Global insured losses from natural disasters reached approximately $100 billion in 2023 — and uninsured losses were considerably higher. Developing countries tend to bear a disproportionate share of climate-related economic losses relative to their GDP. The economic cost of inaction on climate change is projected to significantly exceed the cost of mitigation: the Stern Review (2006) estimated that unmitigated climate change could reduce global GDP by 5–20%, while the cost of stabilising emissions would be approximately 1% of GDP per year.
Quick Check: Describe one physical and one human effect of climate change. Include a specific statistic for each.
Physical: Sea levels have risen 21–24 cm since 1880 and are currently rising at 3.7 mm/year. This threatens low-lying countries such as the Maldives (average elevation 1.5 m) and coastal cities such as Miami and Jakarta with increasing flood risk. Human: The World Bank projects that 216 million people could be forced to migrate internally within their own countries by 2050 as climate change makes regions uninhabitable through water stress, crop failures and sea level rise. This would represent one of the largest forced migration events in human history.
🌱 Responses to Climate Change: Mitigation
Mitigation means reducing the causes of climate change — cutting greenhouse gas emissions or enhancing the natural systems (forests, soils, oceans) that absorb CO₂. Mitigation strategies address the root of the problem: if successful, they slow or halt the rise in atmospheric CO₂ and reduce the eventual scale of warming. They require action at every scale — individual, national and international — and are politically challenging because their benefits are global and long-term while their costs are immediate and national.
| Strategy | Named Example | Scale | Key Evidence |
|---|---|---|---|
| International agreement | Paris Agreement, 2015 | Global | 196 countries signed; aim to limit warming to 1.5°C above pre-industrial levels (or 2°C as a maximum); countries submit Nationally Determined Contributions (NDCs) — voluntary emissions reduction plans reviewed every 5 years. Landmark because it was the first legally binding universal climate agreement. However, critics note that current NDCs put the world on track for ~2.7°C of warming — far above the 1.5°C target. |
| Renewable energy transition | Germany's Energiewende | National | Germany's "energy transition" policy began in 2000 and aims to reach a virtually zero-carbon electricity system by 2045. By 2023, approximately 59% of Germany's electricity came from renewables — primarily wind (35%) and solar (12%). Germany has installed over 100,000 wind turbines. The policy has required significant investment and has faced challenges from grid stability, but has made Germany a world leader in renewable deployment. |
| Electric vehicle adoption | Norway's EV policy | National | Norway achieved approximately 80% of new car sales being electric in 2023 — by far the highest proportion of any country in the world. This was achieved not through direct mandates but through financial incentives: EVs are exempt from purchase tax (which on conventional cars can double the vehicle price), VAT, road tolls and ferry charges, and receive free or subsidised parking. The policy has been described as the most cost-effective EV adoption programme globally, though critics note Norway's unique context (high incomes, cheap hydroelectric power, oil wealth subsidising the incentives). |
| Carbon capture and storage (CCS) | Sleipner Project, Norway | Industrial/national | The Sleipner Project, operated by Equinor in the North Sea, has been injecting approximately 1 million tonnes of CO₂ per year into a porous sandstone reservoir 1,000 m below the seabed since 1996 — making it the world's longest-running commercial CCS project. The CO₂ is captured from natural gas processing before it reaches the atmosphere. After 25+ years of operation, monitoring shows the CO₂ remains securely stored. CCS is controversial: critics argue it is expensive and allows continued fossil fuel use; supporters argue it will be essential for "hard to abate" industries like cement and steel where emissions cannot easily be eliminated. |
| Reforestation | Ethiopia's Green Legacy Initiative | National | Ethiopia launched the Green Legacy Initiative in 2019, with a target of planting 20 billion trees by 2022. The project engaged millions of citizens in mass planting events — on one day in July 2019, an estimated 353 million seedlings were planted in 12 hours. Trees absorb CO₂ through photosynthesis and store it in biomass and soil. However, the effectiveness of large-scale tree planting depends on survival rates and long-term management — not all planted trees survive to maturity. |
Mitigation strategies vary enormously in scale, cost and feasibility. International agreements like the Paris Agreement set the overall framework but rely on voluntary national action. Technological solutions like CCS exist but remain expensive and limited in scale. The political challenges of mitigation — particularly the mismatch between countries that have emitted most historically (wealthy industrialised nations) and countries that are most vulnerable to climate impacts (poorer, tropical nations) — remain one of the most difficult obstacles to global action.
🏗️ Responses to Climate Change: Adaptation
Adaptation means adjusting how societies live and work to cope with the effects of climate change that are already happening or unavoidable. Even if all human emissions stopped tomorrow, some warming and its consequences are already locked in. Adaptation does not address the cause of climate change — it manages the consequences. It is generally more immediately achievable than global mitigation but does not reduce the underlying risk for future generations. The exam regularly asks you to compare HIC and LIC adaptation strategies, emphasising how wealth determines the capacity to adapt.
| Country | Classification | Strategy | How It Adapts | Specific Evidence |
|---|---|---|---|---|
| Maldives | Small island developing state (SIDS) | Sea wall construction and artificial island creation | Protects extremely low-lying atolls from sea-level rise and storm surge | Hulhumalé, an artificial island constructed by reclaiming land from the lagoon, was built to 2 m above sea level — significantly higher than the natural islands. A $500 million sea wall surrounds the capital, Malé. However, these measures are expensive and may only delay the problem rather than solve it permanently. |
| Bangladesh | LIC (Lower-Income Country) | Floating gardens (baira technique) | Grows food on water-logged land during seasonal flooding | In the Barisal region of southern Bangladesh, farmers use an ancient technique of constructing floating vegetation rafts from decomposing water hyacinth. Vegetables and seedlings are grown on these floating platforms, maintaining food production when fields are submerged under floodwater. The technique is low-cost, uses locally available materials, and can be scaled without government investment — critical in a country where 10% of land is less than 1 m above sea level. |
| Bangladesh | LIC | Climate-resilient crop varieties | Flood-tolerant rice varieties allow harvests in increasingly waterlogged conditions | BINA Dhan 11 is a submergence-tolerant rice variety that can survive up to 14 days completely submerged in floodwater. It has been distributed to over 2 million farmers across flood-prone districts by the Bangladesh Institute of Nuclear Agriculture. As flooding frequency and duration increases with climate change, such varieties could prevent catastrophic food security failures for one of the world's most climate-vulnerable nations. |
| Netherlands | HIC (Higher-Income Country) | Room for the River programme | Relocates flood defences inland to give rivers more floodplain space, protecting major cities | The Room for the River programme involved a fundamental shift in flood management philosophy: rather than building higher levees to contain rivers, the Dutch widened floodplains, relocated polders (drained agricultural land), moved dykes further back from riverbanks, and deepened side channels to give rivers more room to expand safely. The programme cost approximately €2.3 billion and affected 37 locations along the Rhine, Meuse and other rivers. It was completed in 2015 and also created biodiversity benefits as natural floodplain habitats were restored. |
| Netherlands | HIC | Floating and amphibious architecture | Buildings designed to rise with floodwater rather than resist it | Over 100 amphibious homes have been built in Buoyant Foundations communities including IJburg, Amsterdam. These houses sit on hollow concrete foundations that allow them to float upward on rising floodwater and then settle back down as water recedes — remaining connected to utilities through flexible connections throughout. This "living with water" approach accepts that flooding will occur and designs around it, rather than trying to prevent it entirely. |
The contrast between Bangladeshi and Dutch adaptation strategies illustrates a fundamental principle: adaptation capacity is closely linked to development level. The Netherlands can invest billions in engineered flood management because it has a GDP per capita of approximately $55,000 and a world-leading tradition of water engineering. Bangladesh, with GDP per capita of approximately $2,500, relies on lower-cost community-based and agricultural approaches. The Maldives, despite being a middle-income country in relative terms, faces existential risk from sea level rise regardless of wealth. This raises profound ethical questions about climate justice: the countries most vulnerable to climate change are often those that have contributed least to causing it.
Quick Check: Give one adaptation strategy from a HIC and one from a LIC. For each, explain how it helps cope with a specific climate change effect.
HIC (Netherlands): The Room for the River programme (€2.3 billion, 37 locations) widened floodplains and moved dykes back from riverbanks, giving rivers more space to expand safely during periods of high flow. This adapts to increased flood risk as more intense rainfall events become more frequent under climate change. LIC (Bangladesh): Flood-tolerant rice varieties such as BINA Dhan 11, which can survive 14 days of complete submergence, allow farmers to maintain food production as seasonal flooding becomes longer and more severe with climate change. This low-cost approach has been distributed to over 2 million farmers and requires no large-scale infrastructure investment.
📖 Key Terms
greenhouse gases — Gases that absorb and re-emit outgoing infrared (heat) radiation from Earth's surface, trapping heat in the lower atmosphere. The main greenhouse gases are CO₂, methane (CH₄), nitrous oxide (N₂O) and water vapour. Human activities have increased CO₂ from ~280 ppm pre-industrially to 421 ppm in 2023 — the highest level in at least 3 million years.
enhanced greenhouse effect — The intensification of the natural greenhouse effect caused by human emissions of greenhouse gases. Higher concentrations of CO₂ and other GHGs trap more outgoing heat, creating a planetary energy imbalance that drives global warming. The IPCC Sixth Assessment Report (2021) states it is "unequivocal" that human influence has caused this warming.
mitigation — Actions that reduce the causes of climate change by cutting greenhouse gas emissions or enhancing carbon sinks. Examples: renewable energy, energy efficiency, reforestation, carbon capture, international agreements (Paris Agreement). Mitigation addresses the root cause but requires sustained global cooperation.
adaptation — Adjusting human activities to cope with the effects of climate change that are already unavoidable. Examples: sea walls (Maldives), flood-tolerant crops (Bangladesh), Room for the River (Netherlands). Adaptation manages consequences rather than causes.
Milankovitch cycles — Natural variations in Earth's orbital shape, axial tilt, and wobble that alter the distribution of solar radiation over tens of thousands to hundreds of thousands of years, driving ice ages and warm interglacials. They are far too slow to explain modern warming.
sea level rise — The rise in global mean sea level caused by thermal expansion of seawater and melting of land-based ice (glaciers, ice sheets). Sea levels have risen 21–24 cm since 1880 and are currently rising at 3.7 mm/year, threatening low-lying countries and coastal cities.
carbon sink — A natural system that absorbs more CO₂ from the atmosphere than it releases. Forests, oceans and soils act as carbon sinks. Deforestation destroys carbon sinks and releases stored carbon, contributing to rising atmospheric CO₂ concentrations.
carbon capture and storage (CCS) — Technology that captures CO₂ from industrial processes or power generation and stores it permanently underground, preventing it from entering the atmosphere. Example: the Sleipner Project, Norway, which has injected 1 million tonnes of CO₂ per year into North Sea sandstone since 1996.
phenology — The study of seasonal biological events such as first flowering, migratory bird arrival and hibernation. Phenological records provide biological evidence of climate change — UK spring is arriving 26 days earlier than in the 1980s.
positive feedback — A process in which an initial change amplifies further change in the same direction. Example: melting Arctic sea ice exposes darker ocean water, which absorbs more solar radiation than white ice, causing further warming and further melting. Positive feedbacks are a major concern in climate science because they can accelerate warming beyond what direct emissions would cause.
⚠️ Common Misconceptions
Misconception 1: "Climate change is entirely natural — humans are not responsible."
This is the most important misconception to address, and it requires a nuanced response. Climate has always changed naturally — through Milankovitch orbital cycles, solar variation, and volcanic eruptions — and you must know these natural causes for the exam. However, the current rate of warming cannot be explained by natural causes alone. Milankovitch cycles operate over thousands to hundreds of thousands of years, not decades. Solar output has shown a slight cooling trend since the 1980s. Volcanic eruptions cause temporary cooling, not warming. Scientists can calculate the warming that would be expected from natural factors alone — it is much smaller than the observed warming, and has been in the wrong direction (slight cooling) in recent decades. The IPCC Sixth Assessment Report (2021) concludes with "unequivocal" certainty that human influence is the dominant cause of warming since 1950. CO₂ has risen from 280 ppm to 421 ppm — a level not seen in 3 million years — precisely because of fossil fuel burning. In the exam, acknowledge natural causes but explain why they cannot account for modern warming.
Misconception 2: "Mitigation and adaptation are the same thing."
These are fundamentally different strategies and must not be confused in the exam. Mitigation targets the cause of climate change: it aims to reduce greenhouse gas emissions or enhance carbon sinks, thereby slowing or stopping the rise in atmospheric CO₂. Examples include switching to renewable energy, improving energy efficiency, protecting forests, and developing CCS technology. Adaptation targets the consequences of climate change: it adjusts how societies cope with effects that are already happening or now unavoidable. Examples include building sea walls, developing flood-tolerant crops, and redesigning urban drainage systems. Both are necessary — mitigation to limit future warming, adaptation to manage what is already locked in — but confusing them in an exam answer will cost you marks and signals a fundamental misunderstanding of the topic.
Misconception 3: "Climate change is mainly an environmental problem about polar bears and melting ice."
While environmental effects (coral bleaching, species loss, glacier retreat, sea ice decline) are real and serious, the most important effects for GCSE Geography are the social and economic impacts on human populations — and these are where the highest exam marks are usually awarded. Sea level rise threatens the homes of hundreds of millions of people: Bangladesh alone has 17 million people at risk of displacement. The IPCC projects 216 million internal climate migrants by 2050. Changing rainfall patterns threaten food and water security across sub-Saharan Africa, South Asia and the Middle East. Economic losses from extreme weather are rising: global insured disaster losses reached $100 billion in 2023. A strong exam answer covers physical, social and economic effects — not just the image of a polar bear on melting sea ice.
Misconception 4: "If volcanoes erupt more, that will balance out human-caused warming."
Volcanic eruptions cause cooling, not warming. When a major volcano erupts, it injects sulphur dioxide into the stratosphere, which forms reflective sulphate particles that block incoming solar radiation. Mount Pinatubo's 1991 eruption reduced global average temperatures by approximately 0.5°C for 1–2 years. However, this effect is temporary — within a few years, the sulphate particles settle out and temperatures return to normal. Volcanoes do release CO₂, but the amount is approximately 100 times smaller than human annual emissions. Volcanic CO₂ is therefore a negligible contributor to the enhanced greenhouse effect.
🧠 Exam Framework: CHEERS
Use this six-point framework to structure any climate change question:
For the Paris Agreement: 1.5-2-5
- 1.5°C — target limit of warming above pre-industrial levels
- 2°C — maximum acceptable warming limit
- 5 years — cycle for reviewing NDCs (Nationally Determined Contributions)
- 196 — number of countries that signed
Greenhouse gas warming potentials (vs CO₂):
- CO₂ = 1 (baseline)
- Methane = 28× (livestock, rice, landfill)
- Nitrous oxide = 265× (fertilisers)
- CFCs = thousands× (now largely banned)
🎯 Exam Connection — GCSE Geography
Paper: examined across all major boards — AQA (Paper 1, Section A: The Challenge of Natural Hazards), Edexcel (Weather hazards and climate change / Climate Change Over Time), and OCR B (Paper 1 — Our Natural World, Global Hazards, Topic 1 — climate change as a hazard context).
Exam frequency: Very high on every board — climate change appears explicitly in almost every paper as a context for other hazard questions, as well as in dedicated question sections. It is also a cross-paper theme: understanding climate change is essential for questions about coasts, rivers, ecosystems and development.
Typical Question Types for This Topic (OCR-style below; AQA and Edexcel examine the same content at the same command-word depth):
- "State one piece of evidence that global temperatures are rising." [1–2 marks] — Give a specific statistic. Example: "The global average temperature in 2023 was 1.45°C above the pre-industrial baseline, making it the hottest year ever recorded." Or: "Ice cores show CO₂ has risen from 280 ppm to 421 ppm — the highest level in at least 3 million years."
- "Explain one natural and one human cause of climate change." [4 marks] — Two explained points. Natural: Milankovitch cycles change how much solar radiation reaches Earth over 20,000–100,000-year cycles — but they operate far too slowly to explain modern warming. Human: burning fossil fuels releases 38 billion tonnes of CO₂ per year, increasing atmospheric concentrations and enhancing the greenhouse effect.
- "Explain how the enhanced greenhouse effect leads to global warming." [4 marks] — You need the mechanism: solar radiation passes through → Earth emits infrared → greenhouse gases absorb and re-emit infrared → more heat trapped → energy imbalance → warming. Link to increased concentrations from human activities.
- "Assess the effectiveness of strategies to manage climate change." [6–8 marks] — This requires named examples of both mitigation and adaptation, with a supported judgement. Compare at least two strategies (e.g. Paris Agreement vs Netherlands Room for the River). Judge which approach is more effective/realistic.
- "How far does development level affect the ability of countries to adapt to climate change?" [6–8 marks] — Compare HIC (Netherlands: €2.3 billion programme) with LIC (Bangladesh: floating gardens, flood-tolerant rice). Make a supported judgement — yes, wealth matters enormously, but LIC approaches can also be highly effective and appropriate.
What Gets You to Level 3 (Top Marks):
- Specific statistics — "421 ppm", "38 billion tonnes", "3.7 mm/year", "28 times more potent" — not vague descriptions
- Named examples with detail — "Germany's Energiewende" or "the Sleipner Project, Norway (since 1996)" — not "some countries are using renewables"
- The mechanism, not just the fact — "because CO₂ absorbs and re-emits infrared radiation, trapping heat" — not just "CO₂ causes warming"
- A supported judgement for assess/evaluate questions — "Overall, adaptation strategies are more immediately achievable because... although mitigation is essential in the long term because..."
- Linking physical cause to human consequence — "sea level rise of 3.7 mm/year threatens 17 million people in Bangladesh living below 1 m elevation"
Command Words for Climate Change (used the same way across AQA, Edexcel and OCR B):
- State / Describe: Give the key information — ideally with a statistic. No explanation needed.
- Explain: Give a reason WITH a mechanism — "because" is essential. Link cause to effect through a chain of reasoning.
- Assess / Evaluate: Make a supported judgement — consider both sides, give evidence, reach a conclusion. "Overall..." is your final sentence.
- Compare: Explicitly state similarities AND differences using "whereas", "however", "in contrast". Do not write two separate descriptions — link them.
💡 Exam Tips for Climate Change
🎯 Common Question Types and Mark Allocations:
- 1–2 mark "state" questions: give one specific statistic as your answer (e.g. "1.45°C above baseline in 2023")
- 4-mark "explain" questions: two explained points, each with a mechanism — use "because" and "this means that"
- 6–8 mark "assess/evaluate" questions: named examples + evidence + judgement + "overall" conclusion
- Comparison questions: always use "whereas" or "in contrast" to link your two examples explicitly
📝 Key Command Words to Watch:
- Describe: What is it? Use data. No need for "because" or "this means".
- Explain: Why does it happen? Always use "because" and trace the mechanism one step further.
- Evaluate/Assess: How effective? Consider positives, limitations, and make a judgement. Never just describe.
- Compare: Do not write two paragraphs in isolation — actively compare using contrast language.
⚠️ Common Mistakes to Avoid:
- Saying "climate change is mainly caused by pollution" — pollution and greenhouse gas emissions overlap but are not the same; be specific about which gases and sources
- Mixing up mitigation and adaptation — know the precise distinction before writing a single word
- Writing about effects without statistics — "sea levels are rising" scores nothing; "sea levels have risen 21–24 cm since 1880 and are currently rising at 3.7 mm/year" scores marks
- Forgetting to include named countries and specific examples for adaptation — "some countries build sea walls" is Level 1; "the Maldives built a $500 million sea wall around Malé and constructed Hulhumalé island at 2 m above sea level" is Level 3
- Treating climate change as purely environmental — examiners want social, economic and political dimensions, especially in higher-mark questions
- Making moral judgements without evidence — "it is wrong that rich countries pollute most and poor countries suffer most" is an opinion; "the IPCC projects 216 million climate migrants by 2050, predominantly from LICs that contributed least historically to emissions" is an evidenced analysis
Quick Check: Write a Level 3 sentence evaluating whether mitigation or adaptation is the more important response to climate change. Include named examples and evidence.
Example Level 3 answer: "Both mitigation and adaptation are necessary, but mitigation is more important in the long term because it addresses the root cause of climate change rather than managing its symptoms. Without deep cuts in emissions — as required by the Paris Agreement's 1.5°C target, signed by 196 countries in 2015 — adaptation will eventually become impossible as sea levels rise beyond what sea walls can hold and temperatures exceed crop tolerance ranges. However, adaptation is more immediately achievable: Bangladesh's flood-tolerant BINA Dhan 11 rice can be distributed to millions of farmers within years, whereas Germany's Energiewende took two decades to reach 59% renewable electricity. Crucially, LICs such as Bangladesh that contributed least to global emissions have the least capacity to fund major mitigation programmes, meaning the ethical burden falls on HICs to lead on mitigation while supporting LIC adaptation. Overall, without sustained mitigation to limit warming below 2°C, adaptation alone cannot protect the most vulnerable nations."
Make this stick
Signing in gives access to all PrepWise features.