Test yourself on Map and Spatial Skills with exam style questions, marked instantly.
Flashcards that come back just before you would forget them.
A revision plan that remembers what you know and shows what to do next.
See which topics you have nailed and which need another look.
Quiz yourself on Map and Spatial SkillsGet your flashcardsBuild my revision planTrack my progress🗺️ Lost on Dartmoor With Only a Map
This is not a hypothetical. It happens every year. It also happens in your geography exam — except the stakes are marks, not survival. Map reading is one of the most practical, directly testable skills in GCSE Geography. Almost every question in Paper 3 (and many in Papers 1 and 2) gives you a map extract and expects you to use it as evidence. Students who know their map skills treat these questions as free marks. Students who do not lose them.
This topic teaches you every map skill tested at GCSE — OS maps, grid references, scale, contour lines, bearings, latitude and longitude, and how to use different map types. By the end, you will not just be able to read a map. You will be able to use a map to build a geographical argument.
🔍 OS Maps: The Foundation of All Map Skills
An Ordnance Survey (OS) map is a detailed, accurate topographic map of the UK produced by the national mapping agency. Unlike a road atlas or Google Maps, an OS map shows both physical features (rivers, hills, woodland, valleys) and human features (roads, buildings, field boundaries, churches, post offices). Everything is drawn to scale using a standardised set of symbols. If you can read an OS map, you can read almost any topographic map in the world.
Two scales matter for GCSE:
1 cm on the map = 25,000 cm in reality = 250 m on the ground. This is a large-scale, highly detailed map used for walking and outdoor activities. It shows individual field boundaries, footpaths, gate symbols, and contour lines at 5 m vertical intervals. You can distinguish individual buildings.
1 cm on the map = 50,000 cm in reality = 500 m on the ground. This is a smaller-scale map that covers a larger area on each sheet — useful for planning routes across a region. Contour lines at 10 m vertical intervals. Less detail than 1:25,000 but much more commonly used in GCSE exam questions.
1:25,000 = large scale (close up, detailed, small area). 1:50,000 = smaller scale (zoomed out, less detail, larger area). Think of a microscope: high magnification (large scale) shows a tiny area in detail.
Calculating Distances Using Scale
Every GCSE exam includes at least one distance calculation. The method is always the same:
- Measure the distance on the map in centimetres using a ruler (for straight lines) or a piece of string/paper edge (for curved routes such as a river or road)
- Multiply by the scale denominator to get the real-world distance in the same units
- Convert to metres or kilometres
Worked example (1:50,000 map): Two points on a map are 6 cm apart. Real distance = 6 × 50,000 cm = 300,000 cm = 3,000 m = 3 km.
Worked example (1:25,000 map): Two points are 8 cm apart. Real distance = 8 × 25,000 cm = 200,000 cm = 2,000 m = 2 km.
The quicker method students use in exams: on a 1:50,000 map, 2 cm = 1 km. On a 1:25,000 map, 4 cm = 1 km. Memorise these two shortcuts.
Key OS Map Symbols You Must Recognise
The full key is printed on every OS map, but you cannot afford to spend exam time looking up every symbol. These are the ones that appear most often in questions:
| Symbol | What It Shows | Why It Matters in Questions |
|---|---|---|
| Blue lines (thin) | Rivers and streams | Settlement location, flooding risk, physical features |
| Blue shading / reservoir outline | Lakes, reservoirs, ponds | Water supply, recreation, physical landscape |
| Green shading (conifer outline) | Coniferous woodland | Land use, economic activity |
| Green shading (deciduous outline) | Deciduous woodland / mixed woodland | Land use, conservation |
| Church with tower: ■ with cross | Church with tower | Settlement age, historical feature |
| Church without tower: + or † | Church without tower / chapel | Settlement, cultural feature |
| Spot height: • 324 | Exact elevation above sea level at that point | Relief questions, identifying highest points |
| Triangulation pillar: △ 324 | Surveyed summit or high point | Highest elevation on map extract, useful in "describe relief" answers |
| P (blue) | Parking | Accessibility, tourism |
| Red dashed line | Footpath or bridleway | Tourism, accessibility, land use |
| Pink/orange shading | Urban area | Settlement patterns, land use change |
| Dark grey (buildings) | Individual buildings | Farm, isolated dwelling, industrial building |
📐 Grid References: Pinpointing Locations Precisely
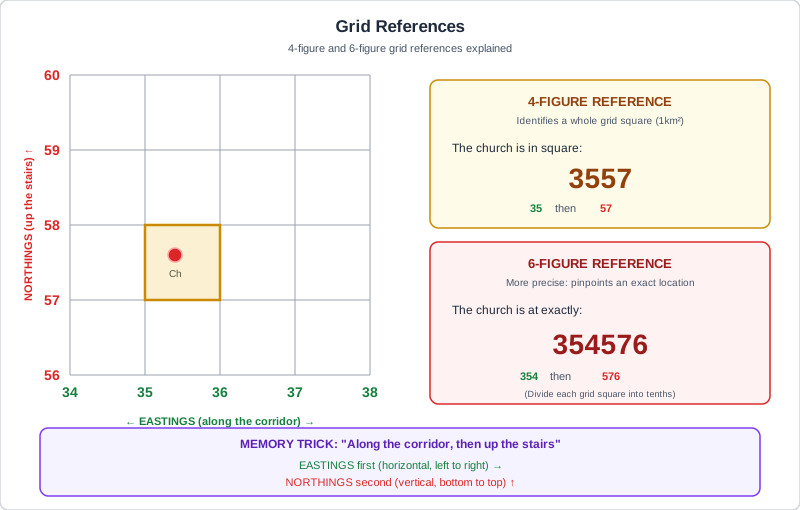
Figure 1: Grid References — 4-figure (1 km square) and 6-figure (100 m precision)
OS maps are divided into a grid of numbered squares. The vertical lines are called eastings (they increase going east, left to right). The horizontal lines are called northings (they increase going north, bottom to top). Every location on the map can be described using these grid lines.
The golden rule — and the most important phrase in map skills — is: "Along the corridor, then up the stairs." Always read the easting (horizontal position, along the bottom) before the northing (vertical position, up the side). Get this order wrong and you give a completely different location.
4-Figure Grid References
A 4-figure grid reference identifies a 1 km × 1 km square. It is not a point — it is an area. The reference is formed by taking the easting of the left-hand (western) edge of the square, then the northing of the bottom (southern) edge.
6-Figure Grid References
A 6-figure grid reference pinpoints a location to a 100 m × 100 m square — ten times more precise than a 4-figure reference. To achieve this, each 1 km grid square is mentally divided into tenths (10 equal strips in each direction).
Checking yourself: Your 6-figure reference should start with the same two digits as the easting from your 4-figure reference, and the 4th and 5th digits should start the same as the northing from your 4-figure reference. If your 4-figure was 4210 and your 6-figure starts 37..., something has gone wrong.
Quick Check: A church is located 3 tenths east and 7 tenths north within the grid square where the easting is 52 and the northing is 34. What is the 6-figure grid reference?
The 6-figure grid reference is 523347. Method: Start with the 4-figure reference — easting 52, northing 34 gives 5234. Then add the tenths: 3 tenths east = third digit 3; 7 tenths north = sixth digit 7. Result: 523347. The key check: does it start 52? Yes. Does the 4th digit start with 34? Yes (digits 4 and 5 are 34). Confirmed correct. Remember: along the corridor (easting) first, then up the stairs (northing).
⛰️ Contour Lines and Relief: Reading the Shape of the Land
You cannot see hills and valleys in a flat map without some way of encoding height. Contour lines do this by connecting all points of equal height above sea level. On a 1:50,000 map, contours are drawn every 10 m in height. Every fifth contour (every 50 m) is drawn thicker and labelled — this is called an index contour. On a 1:25,000 map, contours are drawn every 5 m, with an index contour every 25 m.
The single most important thing to understand about contour lines is that their spacing tells you the steepness of the slope, not the height of the land. The height is given by the number written on the contour line.
What Contour Patterns Tell You
| Contour Pattern | What It Means | Feature |
|---|---|---|
| Very closely spaced contours | Very steep slope — significant gradient, difficult to cross | Cliff, steep hillside |
| Widely spaced contours | Gentle slope or nearly flat land | Flood plain, valley floor, plateau |
| No contours visible | Flat land (below 5 or 10 m height difference in this area) | Low-lying plains, coastal flat |
| Concentric rings getting smaller | A hill — each inner ring is higher than the outer ring | Hill, summit |
| V-shape pointing uphill (upstream) | A river valley — the V points in the direction of higher ground | River valley, stream channel |
| U-shape or elongated oval | A ridge — high ground extending in one direction | Ridge, spur |
| Contours on both sides, no contours in the middle | A col or saddle — low point between two higher areas | Mountain pass |
Describing Relief in Exam Answers
The command "describe the relief shown" is one of the most commonly asked map questions at GCSE. "Relief" means the shape of the land — its height, slopes, and patterns. Weak answers just say "hilly in the north and flat in the south." Strong answers use specific evidence from the contour pattern.
This gives no contour evidence, no specific heights, no direction — 1 mark maximum.
Uses specific heights and spacing observations — 3–4 marks.
Links contour evidence to specific features, uses precise heights, notes settlement patterns — 5–6 marks.
Calculating Gradient
Gradient tells you exactly how steep a slope is. The formula is: gradient = rise ÷ run, where rise is the difference in height between two points (from contour values) and run is the horizontal distance between them (measured with scale).
Example: Two points are 3 cm apart on a 1:50,000 map (= 1,500 m on the ground). The contour at point A is 100 m and at point B is 200 m — a rise of 100 m. Gradient = 100 ÷ 1,500 = 1:15. This means for every 15 m of horizontal distance, the slope rises 1 m — a moderate gradient suitable for walking.
Quick Check: Two points are 4 cm apart on a 1:50,000 map. The contour at point A reads 150 m and point B reads 250 m. Calculate (a) the real-world horizontal distance and (b) the gradient of the slope.
(a) Distance: 4 cm × 50,000 = 200,000 cm = 2,000 m = 2 km. (b) Rise = 250 m − 150 m = 100 m. Gradient = rise ÷ run = 100 ÷ 2,000 = 1:20. This means the slope rises 1 m for every 20 m of horizontal distance — a fairly gentle gradient. In exam terms: close contour lines (100 m rise over 2 km) indicate a moderate slope — not a cliff but not flat either.
🧭 Direction, Bearings, and Latitude/Longitude
Compass Directions
The 8-point compass is used in geography to describe the direction of movement or the relative position of features. You need to know all eight points and be able to estimate which one applies from a map extract.
| Point | Abbreviation | Approximate Bearing |
|---|---|---|
| North | N | 000° |
| North-East | NE | 045° |
| East | E | 090° |
| South-East | SE | 135° |
| South | S | 180° |
| South-West | SW | 225° |
| West | W | 270° |
| North-West | NW | 315° |
3-Figure Bearings
A bearing is a precise direction given as a 3-figure number from 000° to 360°, measured clockwise from north. Bearings are always written with three digits — so north is 000°, not 0°; east is 090°, not 90°.
To measure a bearing from point A to point B:
- Place a protractor at point A with the 0° mark pointing north (towards the top of the map)
- Draw or imagine a line from A to B
- Read the angle clockwise from the north line to the A-to-B line
- Write it as a 3-figure number (add leading zeros if needed)
Examples:
- B is directly north of A → bearing = 000°
- B is directly east of A → bearing = 090°
- B is south-east of A → bearing = approximately 135°
- B is directly south of A → bearing = 180°
- B is north-west of A → bearing = approximately 315°
Common mistake: Students sometimes give the bearing from B to A instead of A to B. These are always 180° different (reciprocal bearings). If asked for the bearing from A to B and you get 240°, the bearing from B to A would be 240° − 180° = 060°.
Latitude and Longitude: Locating Places on Earth
Latitude and longitude are the global coordinate system — they work for any location on Earth, not just the UK. Unlike grid references (which are local to a specific map), lat/long gives an absolute position anywhere on the planet.
London: 51°N, 0°W (on the Prime Meridian — good for remembering Greenwich)
New York: 40°N, 74°W
Sydney: 34°S, 151°E
Nairobi, Kenya: 1°S, 37°E (almost on the equator — useful for comparing with UK)
Tokyo: 36°N, 140°E
📋 Map Types: Strengths, Weaknesses, and When to Use Them
Geography exams ask not just about OS maps, but about statistical and thematic maps used to show data. You need to know what each type shows, its strength, and its key weakness.
| Map Type | How It Works | Best For Showing | Strength | Weakness (Critical for Exams) |
|---|---|---|---|---|
| Topographic (OS) map | Symbols, contours and grid to show physical and human features at scale | Exact locations, relief, land use, distances | Extremely detailed; precise; can be used for navigation and inference | Only covers small area per sheet; requires ability to interpret symbols |
| Choropleth map | Areas (e.g., countries, counties) shaded in different tones or colours based on a value — darker = higher | Spatial patterns of data across areas (e.g., GDP per capita, population density by country) | Instantly shows broad spatial patterns; easy to compare areas; visually striking | Hides variation within areas — a whole country may be one shade even if one city has very different values. Also creates artificial boundaries at the edge of each area. |
| Isoline map | Lines (isolines) connect points of equal value — like contour lines but for any data (temperature, pressure, rainfall) | Continuous variables that change gradually across space (e.g., temperature, rainfall, wind speed, atmospheric pressure) | Shows how a value changes gradually across space; no artificial boundaries; captures smooth transitions | Difficult to read precise values between lines; requires careful interpretation; can look cluttered if lines are closely spaced |
| Dot map | Each dot represents a fixed number of units (e.g., 1 dot = 1,000 people); dots are placed where the phenomenon occurs | Distribution patterns — where is something concentrated and where is it absent? (e.g., population distribution, crop growing locations) | Visually intuitive for showing distribution; immediately shows clustering and sparse areas; easy to interpret | Cannot give exact figures — you can only estimate totals by counting dots. Dot size and placement can also be misleading if not carefully designed. |
| Proportional symbol map | Symbols (circles, squares) are scaled so their area is proportional to the data value — bigger symbol = bigger value | Absolute quantities at specific locations (e.g., city populations, earthquake magnitude at epicentres, trade volumes at ports) | Shows both location AND relative magnitude simultaneously; good for comparing named places | Hard to read precise values — humans are poor at judging areas of circles relative to each other. Can become cluttered if many locations are close together. |
| Flow line map | Arrows or lines show the movement of goods, people, or information; width of line represents the volume of flow | Migration patterns, trade routes, traffic flows, refugee movements | Shows both direction and volume of movement simultaneously; good for identifying key flows and routes | Can become very cluttered with multiple flows; difficult to show return flows and complex networks |
Exam tip on choropleth maps: The most commonly tested weakness is that choropleth maps hide internal variation. If a question asks "what is a limitation of using this map to show population distribution?", the answer almost always includes: "The choropleth shading gives a single value for the whole country/region, hiding the fact that population may be concentrated in certain cities while other areas within the same region are virtually empty."
Quick Check: A choropleth map shows GDP per capita by country, shaded from light (low) to dark (high). A student says "This map proves that Nigeria is uniformly poor." Identify one reason why this conclusion is flawed.
Choropleth maps shade entire countries with a single value, hiding variation within that country. Nigeria has some of the wealthiest individuals and cities in Africa (Lagos is a major financial hub), as well as regions of deep poverty. Using a single national average colour for Nigeria conceals this internal inequality. The map shows the national average GDP per capita — it does NOT show how that wealth is distributed within Nigeria. Any conclusion about whether Nigeria is "uniformly" anything cannot be drawn from a choropleth map.
📸 Aerial Photographs and Satellite Images
Geography exams — especially at OCR B — sometimes provide aerial photographs or satellite images alongside or instead of a map extract. You need to be able to interpret what you see and link it to map evidence.
Two Types of Aerial Photograph
What to Look for in Aerial and Satellite Images
| What You See | What It Suggests |
|---|---|
| Dense, regular grid of streets with terraced housing | Older inner-city residential area, likely 19th-century development |
| Large, regularly spaced buildings with car parks | Industrial estate, retail park, or edge-of-city commercial area |
| Green fields with irregular shapes and hedgerows | Rural farmland — likely pastoral (animal) farming |
| Regular rectangular green fields with straight boundaries | Arable (crop) farming, likely mechanised agriculture |
| Blue/grey water body with white foam line | Coastline — useful for identifying erosion features like cliffs or beaches |
| Dense green canopy with irregular patches | Tropical rainforest or dense woodland |
| Brown/red land with sparse vegetation | Semi-arid or recently deforested area |
| Pale blue/grey urban sprawl with road networks | Urban area expanding into surrounding rural land (urban fringe) |
Linking Photograph to Map
Questions often ask you to identify which part of a map corresponds to a photograph, or to describe what a photograph shows using map terminology. The approach is:
- Identify distinctive features in the photograph: a river bend, a main road junction, a large building, a reservoir
- Find the same features on the map using the OS symbols
- Give the grid reference of the matching area on the map
- Describe any differences between what the photograph and the map show (a photograph may show recent development that postdates the map)
Satellite imagery (e.g., from Google Earth) is particularly useful for showing change over time — comparing images from different years can reveal deforestation, urban growth, coastal erosion, and flood extent. Exam questions may show two satellite images from different years and ask you to describe the change.
📖 Key Terms
OS map (Ordnance Survey map) — A detailed, accurate topographic map of the UK showing both physical and human features using standardised symbols and a precise scale. The two GCSE scales are 1:25,000 (Explorer, 1 cm = 250 m) and 1:50,000 (Landranger, 1 cm = 500 m). Maps use grid lines, contours and a key to encode location, relief and land use.
Grid reference — A code used to identify a location on an OS map. A 4-figure grid reference (e.g., 4210) identifies a 1 km² square — not a precise point. A 6-figure grid reference (e.g., 423104) locates a point within a 100 m × 100 m area by subdividing each km square into tenths. Rule: always give easting before northing — "along the corridor, then up the stairs."
Scale — The ratio between distance on the map and real-world distance. 1:50,000 means 1 cm on map = 500 m in reality (50,000 cm). Larger scale = smaller ratio number = more detail = smaller area covered. Smaller scale = larger ratio number = less detail = larger area covered.
Contour line — A line on a map connecting all points at the same height (altitude) above sea level. On 1:50,000 maps, contours are drawn at 10 m intervals; every 50 m is an index contour (thicker, labelled). Spacing indicates gradient: closely spaced = steep slope; widely spaced = gentle slope. Contours never cross and always form closed loops if followed far enough.
Relief — The shape of the landscape — its height, slopes, valleys, and ridges. Relief is encoded on OS maps using contour lines, spot heights, and triangulation pillars. When describing relief in an exam answer, always use specific contour values and mention the spacing pattern (close/wide) to demonstrate gradient.
Bearing — A direction expressed as a 3-figure number from 000° to 360°, measured clockwise from north. North = 000°, East = 090°, South = 180°, West = 270°. Always written with three digits (not just 90° — always 090°). Used for precise navigation and for describing the direction from one feature to another on a map.
Latitude — Horizontal coordinate lines (parallels) measured in degrees north or south of the equator (0°). Range: 90°N (North Pole) to 90°S (South Pole). The UK lies between approximately 50°N and 61°N. Latitude is always given BEFORE longitude when writing a coordinate pair. Memory aid: lat = flat = horizontal.
Longitude — Vertical coordinate lines (meridians) measured in degrees east or west of the Prime Meridian (0°), which passes through Greenwich, London. Range: 0° to 180°E or 180°W. The UK lies between approximately 2°E and 8°W. Longitude is given AFTER latitude in a coordinate pair.
Choropleth map — A thematic map where areas are shaded according to a data value — typically darker = higher. Used for showing spatial patterns in statistical data (e.g., population density, GDP, rainfall). Key weakness: hides variation within each shaded area and implies sharp differences at boundaries where in reality the change may be gradual.
Isoline map — A map showing lines connecting points of equal value (not just height — any continuous variable). Contour lines are a specific type of isoline. Weather maps use isolines for pressure (isobars) and temperature (isotherms). Reading: areas between isolines have values between the adjacent line values.
Spot height — A dot with a number on an OS map giving the exact altitude at that precise point above sea level. Unlike contour lines (which give height along a whole line), a spot height gives the exact elevation at one specific location. Triangulation pillars (△) mark the most accurately surveyed high points.
Index contour — Every fifth contour line on an OS map, drawn thicker and labelled with its height value. On a 1:50,000 map, index contours appear every 50 m. They help you count up contour values quickly without reading every single line.
⚠️ Common Misconceptions
Misconception 1: "Latitude and longitude — I always get the order wrong"
Why students mix it up: Both are measured in degrees, both can be N, S, E, or W, and both appear together in coordinates. The order is: latitude first, longitude second — always. Multiple memory tricks exist: (a) "LAT = fLAT = horizontal lines that lie flat across the globe — give it first." (b) Alphabetical order: lAtitude comes before lOngitude in the dictionary. (c) Think of it as how you describe position: "how high up am I? (lat) ... how far across am I? (long)." Getting this backwards in an exam loses the mark for any location question — London is 51°N, 0°W (not 0°W, 51°N).
Misconception 2: "A 4-figure grid reference identifies a precise point on the map"
What students think: That 4210 means a specific spot. It does not. A 4-figure reference identifies a 1 km × 1 km square — an area of 1 square kilometre. There could be dozens of features inside that square. If a question asks you to locate a specific church or building, you need a 6-figure reference, which narrows the location down to a 100 m × 100 m area. The difference matters: in an exam question that says "give the 6-figure grid reference of the church", giving a 4-figure answer will score 0 or at best half-marks.
Misconception 3: "If contour lines form a closed ring, it must be a hill summit"
Why this is not always true: Contour lines that form a closed ring could represent a hill (summit inside the ring at higher elevation) but could also represent a depression or hollow — an area of lower ground surrounded by higher land. On OS maps, depressions are shown with tick marks (small lines pointing inward toward the low point, called hachures or depression contours). Always check: are the numbers on the contours increasing as you move inward (hill) or decreasing (depression)? In exam questions, the phrase "hachured contour" or "depression" is a clue that the usual rule is reversed.
Misconception 4: "A larger scale number means a more detailed map"
What students think: "1:250,000 is a bigger number so it must be a more detailed map." This is exactly backwards. A larger scale number in the denominator = smaller scale map = LESS detail. A 1:25,000 map is a large-scale map (more detail, smaller area). A 1:250,000 map is a small-scale map (less detail, larger area). The way to remember it: imagine the ratio as a fraction. 1/25,000 is a bigger fraction than 1/250,000. Bigger fraction = larger scale = more detail. Or just memorise the two GCSE scales: 1:25,000 (detailed, orange cover) and 1:50,000 (overview, pink cover).
🧠 Memory Aids: Map Skills Made Stick
Grid References: The CARTS Method
Use CARTS to remember the steps for a 6-figure grid reference:
Scale Shortcuts (Memorise These Two)
- 1:50,000 map → 2 cm = 1 km
- 1:25,000 map → 4 cm = 1 km
Check: 2 × 50,000 = 100,000 cm = 1 km. 4 × 25,000 = 100,000 cm = 1 km. Both correct.
Bearings: Never-Miss Compass Points
The four cardinal bearings are non-negotiable for exams:
N = 000° | E = 090° | S = 180° | W = 270°
Memory trick: Never Eat Shredded Wheat = N, E, S, W going clockwise. Add 045° for each diagonal: NE = 045°, SE = 135°, SW = 225°, NW = 315°.
Latitude vs Longitude
LAT = fLAT = horizontal lines that lie flat. They go across the globe (east–west) and are always listed first. Longitude lines are LONG — they run from pole to pole (tall, not flat), and come second.
Contour Spacing — The Slope Rule
Close together = steep (like rungs on a ladder that are squashed — hard to climb). Wide apart = gentle (like rungs on a ladder with lots of space — easy stroll).
Map Types — Weakness Quick Reference
- Choropleth: hides variation WITHIN each shaded area
- Dot map: cannot give exact figures
- Proportional symbols: hard to compare circle sizes precisely
- Isoline: difficult to read values between lines
Quick Check: On a 1:50,000 map, two settlements are 7.4 cm apart measured in a straight line. One is at an altitude of 60 m (from contours), the other at 110 m. Calculate (a) the real-world straight-line distance and (b) the gradient of the slope between them.
(a) Distance: 7.4 × 50,000 = 370,000 cm = 3,700 m = 3.7 km. (b) Rise = 110 − 60 = 50 m. Gradient = 50 ÷ 3,700 = approximately 1:74. This is a very gentle gradient — only 1 m of height gain for every 74 m of horizontal distance. In an exam answer you would say: "The slope between the two settlements is very gentle at approximately 1:74, confirmed by the widely spaced contour lines on the map." Always combine the calculation with a contour observation to hit the top mark band.
🎯 Exam Connection
Frequency: Map skills questions appear in EVERY GCSE Geography exam paper that includes a resource booklet (AQA Paper 3, OCR Paper 2, Edexcel 1GA0 Paper 3). They are also embedded throughout Papers 1 and 2 when map extracts accompany case study questions. This topic is guaranteed marks.
Common question types and what they expect:
- "Give the 6-figure grid reference of..." (1–2 marks) → The answer is just the 6-figure code. No explanation needed. Practise the tenths method until it is automatic.
- "Calculate the distance between A and B" (2 marks) → Show your working: measurement in cm × scale factor = answer in metres or km. Always state the unit.
- "Describe the relief of the area shown on the map extract" (4 marks) → Use contour evidence: spacing (steep/gentle), specific heights, feature names (ridge, valley, plateau). Structure: north first, then south, then contrast.
- "Suggest why this settlement is located where it is" (4–6 marks) → Use map evidence: flat land (widely spaced contours), near a river (blue lines), at a road junction, sheltered from prevailing wind (upland to windward side). Minimum two pieces of evidence.
- "Identify one limitation of the choropleth map in Figure X" (2 marks) → State the limitation AND explain it: "The map uses one shade for the whole country, which hides variation within that country. An area with high inequality could show wealthy cities and impoverished rural regions within the same shaded colour."
- "Give the bearing from town A to village B" (1 mark) → State the 3-figure number with degree sign: 127° not "south-east".
The L1/L2/L3 progression for "Describe the relief" (4–6 mark questions):
| Level | What It Sounds Like | Marks |
|---|---|---|
| Level 1 | "The land is hilly in the north and flat in the south." No contour evidence used, no heights quoted, vague directional language. | 1–2 marks |
| Level 2 | "There is a steep hill in the north where contours are closely spaced at 10 m intervals, reaching around 200 m. The valley floor to the south is flat, with widely spaced contours at around 40–50 m." Specific heights used, contour evidence quoted. | 3–4 marks |
| Level 3 | "The extract shows upland terrain in the north where closely spaced 10 m contours indicate a steep north-facing gradient rising sharply from sea level to a triangulation pillar at 324 m. The V-shaped contour pattern in grid square 4210 indicates a river valley cut by the stream flowing south-westward. This contrasts with the flat valley floor to the south, where widely spaced 50 m contours suggest a gradient under 2°. Settlement clusters on this flat land, consistent with the gentle accessible relief." Links contour observations to specific features, identifies patterns, links relief to human activity. | 5–6 marks |
Answer structure for "Suggest why settlement is located here" questions:
- Point: Name the locational advantage (flat land / near water / at road junction / sheltered position)
- Map evidence: Quote the specific feature from the map (e.g., "contours are widely spaced at 80 m suggesting gentle terrain", "blue river symbol in grid square 4210")
- Reason: Explain WHY this advantage mattered for early settlement (flat land is easier to build on and farm; rivers provide water and early transport; road junctions facilitate trade)
- Repeat for second and third locational factors
💡 Exam Tips for Map Skills
🎯 Common Question Types and How to Attack Them:
- Grid reference questions — write the 6-figure code immediately (don't describe it). Practise the tenths method: estimate, do not try to measure precisely. Accuracy within one tenth (100 m) is usually accepted.
- Distance questions — always show the cm measurement AND the scale conversion. "4.5 cm × 50,000 = 225,000 cm = 2.25 km" scores 2 marks. Just writing "2.25 km" with no working may score only 1.
- Describe relief — never just say "steep" or "flat." Say "steep, with contour lines at 10 m intervals closely spaced" or "flat, with very widely spaced contours at 50 m." Include specific heights.
- Map type questions — weakness answers must explain WHY it is a weakness, not just name it. "Cannot give exact figures" scores 1 mark. "Cannot give exact figures because each dot represents a range of values, so the total can only be estimated" scores 2.
📝 Key Command Words for Map Questions:
- Identify / State / Give: Name the feature, grid reference, or measurement — no explanation needed
- Describe: Say what you can observe — use specific values and evidence from the map
- Explain / Suggest why: Give reasons — use map evidence to justify your explanation
- Compare: State both similarities AND differences — never describe one place without the other
- Assess / Evaluate: Judge the suitability using multiple pieces of map evidence — always include at least one advantage and one limitation
⚠️ Common Mistakes to Avoid:
- Writing "grid reference 42, 10" with a comma — grid references are written as a single number: 4210 or 423104. No commas, no spaces.
- Describing relief without mentioning contour lines at all — you must use the evidence the map actually gives you
- Confusing scale direction: "1:250,000 is more detailed than 1:25,000" — this is wrong. 1:25,000 is always more detailed (larger scale).
- Giving a compass direction when asked for a bearing (and vice versa) — "south-east" and "135°" are different answer types. Read the question.
- Forgetting that latitude comes before longitude — "51°N, 0°W" not "0°W, 51°N"
- Treating a 4-figure grid reference as a precise point — it is a 1 km square. If asked for precision, use 6-figure.
Quick Check: A student is asked "Describe the relief of the area." They write: "The area is hilly with some flat parts near the river." Rewrite this as a Level 3 answer using contour evidence and specific heights.
Example Level 3 answer: "The map extract shows considerable variation in relief. The north and west are upland areas where closely spaced 10 m contours indicate steep slopes rising to a triangulation pillar at 287 m. The V-shaped contour pattern pointing north-west confirms the presence of a valley cut by the stream visible as a blue line in grid square 4512. This contrasts with the south of the extract where contours are widely spaced and the land lies at around 40–60 m above sea level, suggesting a gently sloping flood plain. The settlement of X is located on this flat low-lying ground, which is more suitable for building than the steep upland to the north." This answer uses specific heights, names features (triangulation pillar, V-shaped contour), identifies patterns (closely/widely spaced), and links relief to human geography (settlement location).
Make this stick
Signing in gives access to all PrepWise features.