Test yourself on Tectonic Hazards with exam style questions, marked instantly.
Flashcards that come back just before you would forget them.
A revision plan that remembers what you know and shows what to do next.
See which topics you have nailed and which need another look.
Quiz yourself on Tectonic HazardsGet your flashcardsBuild my revision planTrack my progress🌋 The Earthquake That Should Have Killed Thousands
Five years later, on 25 April 2015, a much weaker earthquake — magnitude 7.8 — struck Nepal. Buildings collapsed across the Kathmandu Valley. Ancient temples that had stood for five centuries crumbled in seconds. Around 9,000 people were killed and 2.8 million were made homeless. In the remote mountain villages, rescue teams could not reach survivors for three days.
Chile's earthquake was 32 times more powerful. Nepal's killed 16 times more people. Why the difference? The answer is not geology — it is wealth, governance, and the choices societies make before disaster strikes.
🔍 How Tectonic Hazards Form

Figure 1: The three types of plate boundary. Arrows show the way each plate moves.
Constructive boundaries are also called divergent, destructive are convergent and conservative are transform. The blocks are not to scale.
The Earth's outermost layer, the crust and the rigid top of the mantle, is not a single solid shell. It is broken into roughly 12 large tectonic plates and several smaller ones, all moving slowly across the surface of the planet. This movement is driven by convection currents in the hot, slowly flowing rock of the mantle below: hot rock rises, spreads outward, cools, and sinks again in a slow churning cycle. The plates move at roughly 5 cm per year — about the speed your fingernails grow. Over millions of years, these tiny movements build mountains, open oceans, and generate the world's most destructive natural events.
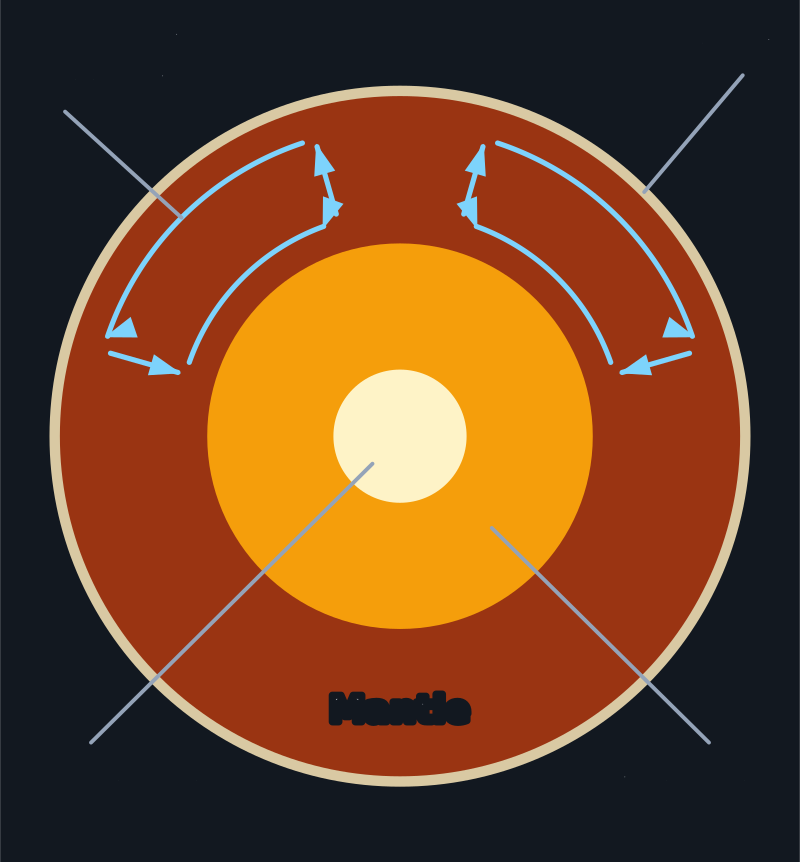
Figure 2: Earth's layers. Heat from the core drives convection currents in the mantle, which move the plates.
The layers are drawn to scale except the crust, which is drawn a little thicker so you can see it. The crust is about 5 km thick under the oceans and up to about 70 km under mountains. The mantle is nearly 3,000 km thick.
Almost all earthquakes and volcanoes occur at or near plate margins — the boundaries where two plates meet. There are three types, each producing different hazards:
When an oceanic plate meets a continental plate, the denser oceanic plate is forced downward into the mantle in a process called subduction. As it descends, friction between the plates generates enormous pressure. When that pressure is released suddenly, it sends seismic waves through the crust — an earthquake. The subducting plate also melts as it descends into the hot mantle, producing magma that rises to form volcanoes above. Example: The Nazca Plate subducting beneath the South American Plate produces both the Andes mountain range and Chile's devastating earthquakes.
When two continental plates converge, neither can subduct (both are too light). Instead they crumple upward, forming mountain ranges. The immense pressure still produces powerful earthquakes, but without subduction there is no magma and therefore no volcanoes. Example: The Indian Plate crashing into the Eurasian Plate has pushed up the Himalayas over 50 million years — and still generates Nepal's earthquakes today.
Here, two plates grind sideways past each other. No crust is created or destroyed, so there are no volcanoes. But the friction as plates lock and then suddenly release generates powerful earthquakes. Example: The San Andreas Fault in California, where the Pacific Plate slides northward past the North American Plate.
As plates pull away from each other, magma rises to fill the gap, creating new oceanic crust and forming volcanoes. Earthquakes here tend to be shallower and less powerful than at destructive margins. Example: The Mid-Atlantic Ridge, where the Eurasian and North American plates separate — Iceland sits on this boundary and experiences both regular earthquakes and volcanic eruptions.
When an earthquake occurs, energy radiates outward from the focus — the underground point of origin — as seismic waves. The point on the surface directly above the focus is the epicentre, which usually experiences the most intense shaking. Shallow-focus earthquakes (less than 70 km deep) cause more surface damage than deep-focus ones because the energy has less distance to travel before reaching buildings and people.
Quick Check: Name the plate margin type that produces earthquakes but NOT volcanoes, and give a named example.
Conservative (transform) margins produce earthquakes but no volcanoes because plates slide past each other — no crust is subducted and no magma is generated. Example: the San Andreas Fault, California, where the Pacific Plate slides past the North American Plate. Collision margins (e.g. Himalayas / Nepal) also produce earthquakes without volcanoes for the same reason — no subduction means no magma.
🏔️ Chile 2010: When Preparation Saves Lives
Chile occupies one of the most seismically active locations on Earth. The Nazca Plate is being subducted beneath the South American Plate along the Peru-Chile Trench, generating earthquakes that regularly rank among the most powerful ever recorded. Chile has lived with this reality for centuries — and, crucially, has used that experience to build resilience into its society.
The Event
At 03:34 on Saturday 27 February 2010, a magnitude 8.8 Mw earthquake struck offshore in the Pacific Ocean, approximately 335 km south-west of Santiago. It lasted for approximately three minutes — an extraordinarily long duration. The epicentre was close to the coastal city of Concepción, Chile's second-largest city. A Pacific-wide tsunami warning was issued within minutes, and tsunami waves of up to 2 metres hit the Chilean coast within 30 minutes of the quake.
Primary Effects
- Approximately 550 people killed — a remarkably low figure for an earthquake of this magnitude
- Around 12,000 people injured
- Approximately 500,000 homes damaged or destroyed
- Around 2 million people displaced from their homes
- Major infrastructure destroyed: roads, bridges, the Biobío River bridge (a critical link between northern and southern Chile), and coastal ports
- Tsunami waves of 2–3 m hit coastal towns including Constitución and Dichato, where hundreds of homes were swept away
- Total economic damage estimated at $30 billion (approximately 18% of Chile's GDP)
Secondary Effects
- Fires broke out in Concepción as gas mains ruptured
- More than 300 aftershocks in the following weeks, the largest measuring 6.9 Mw, hampering rescue and causing additional building collapses
- Widespread looting in Concepción forced the government to impose a curfew and deploy police
- Power outages affected millions of homes across southern Chile
- Water supply disrupted to major cities including Santiago
- Economic disruption from port closures affecting Chile's copper exports (Chile is the world's largest copper producer)
Immediate Responses
- President Michelle Bachelet declared a state of catastrophe within hours, deploying 14,000 military personnel to maintain order and assist rescue efforts
- The Chilean Red Cross coordinated national relief, distributing food, water and emergency shelter
- International aid offers from over 50 countries; Chile accepted targeted assistance rather than general donations
- The Pacific Tsunami Warning Center issued alerts, giving some coastal communities 30 minutes' warning — though the warning system had gaps, and several communities were not evacuated in time
- Chilean hospitals — built to earthquake-resistant standards — remained functional throughout the crisis, allowing medical treatment to continue
Long-Term Responses
- The government launched an $8.4 billion national reconstruction plan, rebuilding roads, bridges, schools and housing within 2–3 years
- Building codes were reviewed and further strengthened — Chile's seismic construction standards are now among the strictest in the world
- The tsunami early warning network was significantly expanded and improved following gaps identified in the 2010 response
- Community resilience training was expanded to include coastal evacuation drills
- Recovery was largely complete within 3–4 years, demonstrating the effectiveness of coordinated national reconstruction
Why Deaths Were So Low
Quick Check: Give two reasons why Chile's death toll was low despite the earthquake being magnitude 8.8.
1. Chile has strict earthquake-resistant building codes (updated after the 1960 Valdivia earthquake, the most powerful ever recorded), meaning modern buildings could withstand significant shaking without collapsing. 2. Chile's high GDP per capita (~$10,000) funded effective emergency services, functional hospitals, and government institutions capable of deploying 14,000 military personnel within hours. Also accept: public preparedness/earthquake drills; prior experience of seismic events; tsunami warning systems.
🏘️ Nepal 2015: When Vulnerability Turns Hazard into Disaster
Nepal sits between two enormous tectonic forces. The Indian Plate has been crashing into the Eurasian Plate for around 50 million years, pushing up the Himalayas — the world's highest mountain range — and generating earthquakes that have repeatedly devastated the region. Nepal is one of the poorest countries in Asia, with a GDP per capita of around $700 in 2015. It has very limited resources to prepare for or respond to the tectonic hazards that its geography makes inevitable.
The Event
At 11:56 on Saturday 25 April 2015, a magnitude 7.8 Mw earthquake struck with its epicentre 77 km north-west of Kathmandu, Nepal's capital and most densely populated city. The earthquake was shallow — just 15 km below the surface — which intensified the shaking at ground level. The timing, on a Saturday morning, meant that schools were empty (schools in Nepal run Monday–Friday), which reduced casualties among children. Had it struck on a school day, the death toll would have been significantly higher.
Primary Effects
- Approximately 9,000 people killed — 16 times more than Chile despite being 32 times less powerful
- Around 22,000 people injured
- Over 600,000 houses completely destroyed; a further 300,000 damaged — total 900,000 structures affected
- 2.8 million people displaced from their homes
- Entire villages in remote mountain districts such as Gorkha, Sindhupalchok and Nuwakot were completely destroyed
- Ancient heritage sites in the Kathmandu Valley — including the UNESCO World Heritage-listed Dharahara tower (built 1832) and temples in Durbar Square — collapsed entirely
- Total economic damage estimated at $10 billion — approximately 50% of Nepal's entire annual GDP
- Mount Everest base camp was struck by an avalanche triggered by the earthquake, killing 19 people and injuring dozens of mountaineers
Secondary Effects
- Hundreds of landslides across the mountain terrain, blocking roads and valleys and burying villages
- Landslides created natural dams across rivers, raising the risk of glacial lake outburst floods which could have caused additional mass casualties downstream
- Disease risk from contaminated water supplies in destroyed communities, particularly in remote areas without access to clean water
- Over 150 aftershocks in the first month, including a major 7.3 Mw aftershock on 12 May 2015 that killed a further 200 people and triggered new landslides
- Nepal's tourism industry — the country's largest source of foreign income — collapsed for the 2015 season, with climbers evacuated from Everest and trekking routes closed
- A mental health crisis emerged in the months following the earthquake, with large numbers of survivors — particularly children — experiencing trauma, anxiety and PTSD
- Long-term economic disruption as reconstruction stretched government resources and aid was slow to reach remote communities
Immediate Responses
- The Nepalese government declared a state of emergency and appealed immediately for international assistance
- India sent 16 aircraft and over 1,000 rescue workers within 24 hours — the fastest international response
- The UK pledged £73 million in emergency and long-term aid
- The UN coordinated a global humanitarian response; over $400 million was pledged within the first week
- However, Nepal's infrastructure severely limited the response: only one major road connects Kathmandu to the rest of the country; Kathmandu's airport could not handle the volume of incoming aid flights; and approximately 60% of Nepal's terrain is only accessible on foot
- Rescue teams could not reach many remote mountain villages for 72 hours or more after the earthquake — by which point the critical survival window of 72 hours had passed for many trapped survivors
- Military helicopters rescued over 4,000 climbers and trekkers stranded on mountain routes
Long-Term Responses
- The government established the National Reconstruction Authority (NRA) in December 2015 — seven months after the earthquake — to coordinate rebuilding
- However, progress was extremely slow: three years after the earthquake, hundreds of thousands of families were still living in temporary shelters
- Concerns were raised about corruption and mismanagement in aid distribution, with some communities reporting they had received little or no support
- A "build back better" approach was promoted, encouraging reconstruction using local stone (traditional material) but with improved earthquake-resistant foundations — yet enforcement was inconsistent
- Nepal's remote terrain meant that reconstruction costs were far higher per household than in an accessible country
- Heritage reconstruction began at Kathmandu's UNESCO sites, but the Dharahara tower was not fully rebuilt until 2021 — six years after its collapse
Why Deaths Were So High
Quick Check: Explain why Nepal's death toll was much higher than Chile's despite the earthquake being less powerful.
Nepal's higher death toll reflects its much greater vulnerability. Unlike Chile, Nepal had very limited earthquake-resistant building standards — traditional unreinforced brick and stone construction collapsed easily. Nepal's GDP per capita (~$700) meant the government had far fewer resources for emergency services and preparedness. The remote mountain terrain blocked rescue access for 72+ hours. In contrast, Chile's wealth (~$10,000 GDP per capita), strict building codes enforced since 1960, and effective governance meant the far more powerful earthquake caused far fewer deaths. This demonstrates that vulnerability and preparedness are more important than physical magnitude in determining disaster scale.
⚖️ Chile 2010 vs Nepal 2015 — Side by Side
| Factor | Chile 2010 (HIC) | Nepal 2015 (LIC) |
|---|---|---|
| Magnitude | 8.8 Mw | 7.8 Mw (32× less energy) |
| Plate margin type | Destructive — Nazca subducting under South American Plate | Collision — Indian Plate crashing into Eurasian Plate |
| Deaths | ~550 | ~9,000 (16× more) |
| Homes destroyed/damaged | 500,000 | 900,000 |
| People displaced | 2 million | 2.8 million |
| Economic damage | $30 billion (~18% of GDP) | $10 billion (~50% of GDP) |
| GDP per capita | ~$10,000 | ~$700 |
| Building quality | Strict seismic codes since 1960; reinforced concrete frame | Unreinforced brick and stone; minimal enforcement |
| Emergency services | Well-funded; hospitals functioning; 14,000 troops deployed within hours | Limited; 1 doctor per 4,000 people; international aid needed immediately |
| Terrain and access | Coastal plain; road network intact; Concepción accessible | 60% mountains; roads blocked by landslides; many villages only accessible on foot |
| Response time | Military deployed within hours; rescue teams on-scene quickly | 72+ hours before rescue reached many remote villages |
| Recovery speed | $8.4bn reconstruction plan; largely complete within 3–4 years | NRA not set up until 7 months later; hundreds of thousands still in temporary shelters 3 years on |
The key lesson: the physical strength of an earthquake does not determine the scale of human suffering — vulnerability and preparedness do.
🌋 Volcanic Hazards
Volcanoes form primarily at destructive margins, where the subducting oceanic plate melts in the hot mantle and produces magma. This magma is less dense than the surrounding rock, so it rises through fissures and weak points in the crust. When it erupts at the surface, it is called lava. But volcanoes pose multiple hazards beyond lava flows — and many of the most deadly are invisible until it is too late.
Volcanoes also form at hotspots — fixed plumes of exceptionally hot mantle that burn through the plate above them regardless of where the plate margin is. Hawaii sits in the middle of the Pacific Plate, far from any plate margin, yet is one of the most volcanically active places on Earth. Iceland sits on the Mid-Atlantic constructive margin, where the Eurasian and North American plates pull apart.
Types of Volcanic Hazard
- Pyroclastic flows — Superheated mixtures of gas, ash and rock fragments that travel at up to 700 km/h and reach temperatures of 1,000°C. These are the deadliest volcanic hazard — survivors are essentially impossible. The 79 AD eruption of Mount Vesuvius killed the residents of Pompeii and Herculaneum via pyroclastic flows.
- Lahars — Volcanic mudflows created when volcanic material mixes with water (from melted snow, crater lakes, or heavy rain). Lahars can travel at 60 km/h and bury entire towns. The 1985 Nevado del Ruiz eruption in Colombia produced a lahar that buried the town of Armero, killing 23,000 people.
- Ash fall — Fine volcanic ash can collapse roofs under its weight, contaminate water supplies, damage aircraft engines, and disrupt agriculture for years across huge areas. The 1991 eruption of Mount Pinatubo, Philippines, spread ash across South-East Asia.
- Lava flows — Molten rock moving across the surface, destroying everything in its path. However, most lava flows are slow enough that people can be evacuated — property is lost, but lives can be saved.
- Volcanic gases — Eruptions release sulphur dioxide, carbon dioxide, and other toxic gases. In 1986, a sudden release of CO₂ from Lake Nyos in Cameroon (a volcanic crater lake) killed 1,800 people in surrounding villages.
Case Study: Mount Pinatubo, Philippines, 1991
The eruption of Mount Pinatubo on 15 June 1991 was one of the largest volcanic eruptions of the 20th century. The volcano is located on the destructive margin where the Philippine Sea Plate subducts beneath the Eurasian Plate. The eruption ejected 10 km³ of material into the atmosphere and produced pyroclastic flows that destroyed everything within 10 km of the volcano.
- ~800 people died — but scientists estimated 50,000 people's lives were saved by successful evacuation
- The Philippine Institute of Volcanology and Seismology (PHIVOLCS) monitored seismic activity in the weeks before the eruption and correctly predicted the timing and scale
- Around 50,000 people were evacuated from the danger zone before the main eruption
- The eruption injected 20 million tonnes of sulphur dioxide into the stratosphere, temporarily reducing global temperatures by 0.5°C — demonstrating how major eruptions can affect global climate
- Lahars caused by heavy monsoon rain mixing with volcanic ash continued for years after the eruption, repeatedly affecting communities in river valleys below the volcano
Pinatubo demonstrates a critical geographical principle: prediction and evacuation can dramatically reduce volcanic fatalities, even when the physical event is enormous. The comparison with Nepal (where building design and access were the limiting factors) shows that the nature of the hazard determines what type of preparation is most effective.
Quick Check: What is the difference between a pyroclastic flow and a lahar?
A pyroclastic flow is a superheated mixture of gas, ash and rock that travels at up to 700 km/h and 1,000°C — essentially impossible to survive. A lahar is a volcanic mudflow, created when volcanic material (ash, rock) mixes with water from melted snow, crater lakes, or heavy rain. Lahars are slower (up to 60 km/h) but can bury entire towns and continue for years after an eruption as rain remobilises ash deposits. Both are secondary volcanic hazards — they occur as a result of eruption rather than being the eruption itself.
📖 Key Terms
lithosphere — The rigid outer layer of the Earth, comprising the crust and the uppermost part of the mantle. It is divided into tectonic plates.
tectonic plate — A large, rigid section of the lithosphere that moves slowly across the surface of the Earth, driven by convection currents in the mantle below. There are roughly 12 major plates.
plate margin — The boundary where two tectonic plates meet. There are three types: destructive (converging plates — subduction or collision), constructive (diverging plates — new crust forms), and conservative (plates sliding past each other). Most earthquakes and volcanoes occur at or near plate margins.
subduction — The process by which a denser oceanic plate is forced downward beneath a less dense continental plate at a destructive margin. The subducting plate melts in the mantle, generating magma and volcanic activity above.
seismic wave — A wave of energy released when rock fractures during an earthquake. Seismic waves travel outward from the focus in all directions, shaking the ground as they pass.
focus — The point underground where an earthquake originates and energy is first released. Also called the hypocentre. Shallow-focus earthquakes (less than 70 km deep) cause the most surface damage.
epicentre — The point on the Earth's surface directly above the focus of an earthquake. It usually experiences the most intense shaking and is the reference point for reporting earthquake locations.
Moment Magnitude Scale (Mw) — The current standard scale for measuring earthquake energy. Each whole number increase represents approximately 32 times more energy released. Chile 2010 was 8.8 Mw; Nepal 2015 was 7.8 Mw — meaning Chile released roughly 32 times more energy.
tsunami — A series of ocean waves generated by a sudden large movement of the seafloor, most commonly caused by an underwater earthquake. Waves can travel at 800 km/h across open ocean and rise to devastating heights as they approach shallow coastal water.
liquefaction — The process by which saturated soil behaves like a liquid during intense shaking. Waterlogged ground loses its strength, causing buildings to tilt and sink. Common in coastal areas and river deltas during major earthquakes.
pyroclastic flow — A fast-moving mixture of superheated gas, ash and rock fragments produced by a volcanic eruption. Pyroclastic flows travel at up to 700 km/h and 1,000°C — essentially unsurvivable without advance evacuation.
lahar — A volcanic mudflow created when volcanic material mixes with water. Lahars can travel at 60 km/h and continue occurring for years after an eruption as rainfall remobilises ash deposits.
vulnerability — How susceptible a population is to the effects of a tectonic hazard, determined by poverty, quality of housing and infrastructure, access to healthcare and emergency services, and the effectiveness of government planning and building regulations.
preparedness — Actions taken before a tectonic event to reduce its impact, including earthquake-resistant building design, early warning systems, regular evacuation drills, stockpiling emergency supplies, and land-use planning to keep people away from the highest-risk zones.
⚠️ Common Misconceptions
Misconception 1: "A bigger earthquake always causes more deaths."
This is the most important misconception to correct for exam questions. The 2010 Chile earthquake measured 8.8 Mw and killed approximately 550 people. The 2015 Nepal earthquake measured 7.8 Mw — physically about 32 times less powerful — yet killed around 9,000 people and left 2.8 million homeless. Nepal's higher death toll reflects its far greater vulnerability: poorly constructed unreinforced brick buildings, remote mountain terrain that made rescue access extremely difficult, and a GDP per capita (~$700) that meant limited emergency resources. Physical magnitude explains the size of the hazard; vulnerability and preparedness explain the scale of the disaster. This is the central lesson of every tectonic hazard comparison question.
Misconception 2: "Volcanoes only erupt at destructive plate margins."
While destructive margins (where subduction occurs) are a major location for volcanoes, they are not the only one. Hawaii is one of the most volcanically active places on Earth yet sits in the middle of the Pacific Plate, far from any plate boundary — it sits above a hotspot, a fixed plume of exceptionally hot mantle. Iceland sits on a constructive margin where the Eurasian and North American plates pull apart, yet has extremely active volcanism. Understanding the three different mechanisms that produce volcanoes (subduction, hotspots, divergent rifting) is important for answering "explain" questions about specific volcanic locations.
Misconception 3: "Scientists can predict exactly when earthquakes will happen."
Earthquake prediction — giving a specific time, location, and magnitude in advance — is not currently possible. Scientists can identify which areas are at high risk based on historical patterns and plate margin locations, and can measure gradual changes in ground deformation. But the precise moment a fault will rupture cannot be predicted. This is why preparedness (earthquake-resistant buildings, evacuation drills, emergency stockpiles) is so much more important than prediction for saving lives. Volcanoes, by contrast, often give warning signs (increased seismic activity, ground deformation, gas emissions) that allow prediction and evacuation, as seen at Mount Pinatubo in 1991.
🧠 Exam Framework: CLEVER
Use this framework to structure any tectonic hazard answer, especially comparisons between two countries:
For plate margin types, use: D.C.C.
- Destructive — subduction — earthquakes AND volcanoes (Chile)
- Collision — crumpling — earthquakes ONLY (Nepal / Himalayas)
- Conservative — sliding — earthquakes ONLY (San Andreas Fault)
- (Constructive — pulling apart — mild earthquakes + shield volcanoes)
🎯 Exam Connection — GCSE Geography
Paper: examined across all major boards — AQA (Paper 1, Section A: The Challenge of Natural Hazards), Edexcel (Hazardous Earth), and OCR B (Paper 1 — Our Natural World, Global Hazards, Topic 1).
Exam frequency: Very high on every board — tectonic hazards appear in every paper sitting, typically with both a case study question and a factors/comparison question.
Typical Question Types for This Topic (OCR-style below; AQA and Edexcel examine the same content at the same command-word depth):
- "Outline one primary effect of an earthquake you have studied." [2 marks] — Name the earthquake, state one specific primary effect with a statistic. Example: "In the 2015 Nepal earthquake (7.8 Mw), approximately 9,000 people were killed and over 600,000 homes were completely destroyed."
- "Explain why some countries suffer more from tectonic hazards than others." [4 marks] — You need two explained reasons. Use vulnerability and preparedness as the structural framework. Link to named examples (Chile vs Nepal).
- "Assess the effectiveness of responses to a tectonic hazard you have studied." [6 marks] — This requires a Level 3 answer: a named case study, specific evidence for and against effectiveness, and a supported judgement. For Nepal, you can argue responses were partially effective (international aid arrived quickly) but ultimately limited (72-hour access delay, 3 years in temporary shelters).
- "Using evidence, explain how the impacts of two tectonic events differed." [6 marks] — Direct Chile vs Nepal comparison. Focus on WHY (vulnerability, preparedness, building quality, wealth) not just WHAT happened.
What Gets You to Level 3 (Top Marks):
- A named case study with specific data (not "a country in South America" — say "Chile" and give the magnitude)
- Explaining the mechanism, not just stating the fact ("because unreinforced brick collapses easily in seismic events" — not just "buildings fell down")
- A supported judgement for assess/evaluate questions ("Overall, Chile's response was highly effective because... although... the tsunami warning system had gaps that...")
- Linking physical geography (plate margin type) to human outcomes (why the hazard occurred here in the first place)
Command Words (used the same way across AQA, Edexcel and OCR B):
- Outline / State: Brief factual answer — give the key point, ideally with a statistic
- Explain: Give reasons WITH mechanisms — "because" is essential; link cause to effect
- Assess / Evaluate: Make a judgement supported by evidence; consider both sides; reach a conclusion
- Compare: Explicitly show similarities AND differences using "whereas" / "however" / "in contrast"
💡 Exam Tips for Tectonic Hazards
🎯 Always Name Both Case Studies
- Chile 2010 = your High-Income Country (HIC) earthquake example
- Nepal 2015 = your Low-Income Country (LIC) earthquake example
- Use them as a pair for any comparison question — one HIC, one LIC, specific statistics for each
- Never say "a developed country" — say "Chile (2010, 8.8 Mw)"
📝 "Because" is Your Most Important Word
- Level 1 answer: "9,000 people died in Nepal." (0–1 marks)
- Level 2 answer: "9,000 people died in Nepal because buildings were not earthquake-resistant." (partial marks)
- Level 3 answer: "Around 9,000 people died in Nepal because traditional unreinforced brick and stone construction — typical of a country with GDP per capita of ~$700 — collapses readily during seismic shaking, whereas Chile's strict building codes (enforced since the 1960 Valdivia earthquake) meant modern structures remained standing despite a 32-times-more-powerful event." (full marks)
⚠️ Common Mistakes to Avoid
- Describing what happened (narrative) rather than explaining why impacts differed (analysis)
- Forgetting secondary effects — landslides, disease, economic disruption after Nepal can score separate marks
- Saying Chile "got lucky" — it was strategic investment in preparedness, not luck
- Confusing the magnitude scale: 8.8 is 32 times MORE powerful than 7.8, not 1.1 times
- Writing about volcanoes when the question asks about earthquakes — check the command carefully
Quick Check: Write a Level 3 sentence explaining why Nepal's death toll was higher than Chile's. Include specific evidence.
Example Level 3 answer: "Nepal's death toll of ~9,000 was far higher than Chile's ~550 despite the Chilean earthquake being 32 times more powerful, because Nepal's greater vulnerability meant the physical hazard caused far more harm. Nepal's GDP per capita of ~$700 meant the government could not enforce earthquake-resistant building codes — traditional unreinforced brick construction collapsed readily, whereas Chile's seismic codes (updated after the 1960 Valdivia earthquake) meant modern buildings survived the 8.8 Mw shaking intact. Nepal's mountainous terrain (60% inaccessible by road) also blocked rescue access for 72+ hours, while Chile's well-funded emergency services deployed 14,000 troops within hours. This comparison demonstrates that vulnerability and preparedness determine the scale of a disaster, not physical magnitude alone."
Make this stick
Signing in gives access to all PrepWise features.