A sealed rigid container holds gas that is warmed up. Figure 5 offers four graphs, A to D, of pressure against temperature in degrees Celsius.
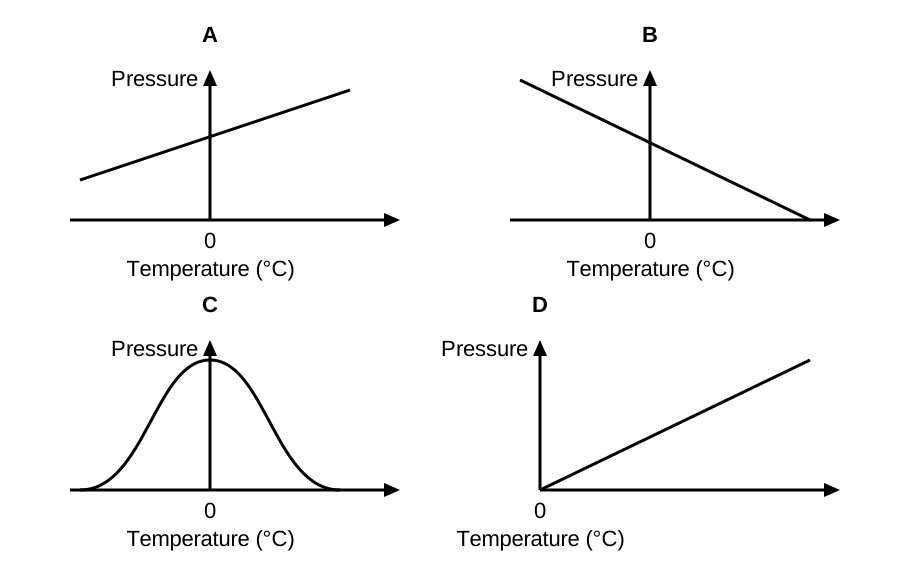
Pick the graph in Figure 5 that shows how the gas pressure changes with temperature.
Our own questions on this topic, marked straight away, so you see what to revise. Free now.
Show model answerHide model answer
When the gas is warmed, its particles move faster and hit the container walls harder and more often, so pressure rises steadily, giving a straight line sloping upwards. The gas still has pressure at 0 degrees Celsius, so the line cuts the pressure axis above zero. That is graph A. Graph D also rises, but it starts at the origin, which would mean zero pressure at 0 degrees Celsius. A line through the origin only happens if temperature is measured from absolute zero, on the kelvin scale. Graph B shows pressure falling as the gas heats, and graph C has pressure highest at 0 degrees Celsius and falling either side, so neither matches the particle model.
How the marks are earned
- Choose graph A: pressure rises steadily as temperature rises, giving a rising straight line that does not pass through the origin because the axis is in degrees Celsius.
- One answer only: two answers earn nothing, and a circled or underlined right option counts if the box is blank.