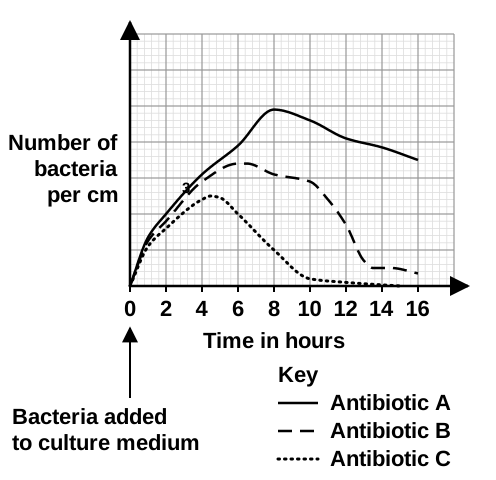
Figure 10 is a drawing of a bacterial cell beside a yeast cell. A scientist grew one type of bacterium in three cultures, each with a different antibiotic and each starting with equal numbers of bacteria. Figure 11 shows how the number of bacteria per cm3 changed with time.
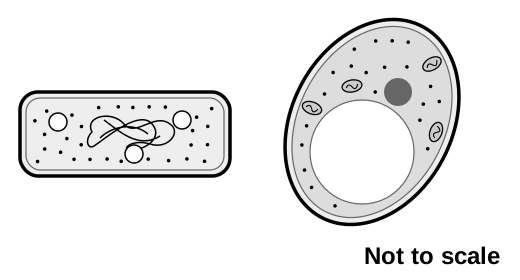
Choose the correct statement about bacterial and yeast cells. Tick one box.
Our own questions on this topic, marked straight away, so you see what to revise. Free now.
Show model answer for 08.1Hide model answer for 08.1
Bacteria are prokaryotes, while yeast cells are eukaryotes.
How the marks are earned
- Tick the box that calls the bacterium prokaryotic and the yeast eukaryotic.
Using Figure 10, name two structures that a yeast cell has and a bacterial cell lacks.
See how you would score on Cell OrganellesShow model answer for 08.2Hide model answer for 08.2
A yeast cell has a nucleus and mitochondria, and it also has a large vacuole. A bacterial cell has none of these.
How the marks are earned
- Any two, one mark each: a nucleus; a vacuole; mitochondria. Chromosomes, or larger ribosomes, are also accepted. If no other mark is earned, one mark is given for membrane-bound structures inside the cell (sub-cellular structures).
Why it scores
Any two of the three earn the two marks. Compare the two drawings carefully, since both cells have cytoplasm, a cell wall and a membrane.
Revise Cell OrganellesCompare the effectiveness of antibiotics A, B and C, using Figure 11.
See how you would score on Antibiotics and Drug ResistanceShow model answer for 08.3Hide model answer for 08.3
For about the first 4 hours all three antibiotics have much the same effect, and the bacteria increase in every culture.
Antibiotic C is the most effective. Its bacteria stop rising first, at about 4 to 5 hours, and peak at the lowest number. They start to fall soonest and are the only ones to reach zero, at about 15 hours.
Antibiotic B is in between. Its bacteria peak at about 6 hours, so they start to fall before those with A, and they fall further and faster than with A. They start to fall later than with C, and a few are still left at 16 hours.
Antibiotic A is the least effective. Its bacteria peak last, at about 8 hours, and at the highest number. They fall most slowly, and at 16 hours there are far more than with B.
How the marks are earned
- This is level marked. An answer worth 3 to 4 marks compares all three antibiotics, says clearly how they are alike or differ, and where useful says by how much. An answer worth 1 to 2 marks picks out relevant features and notes differences.
- Early on: for roughly the first 4 or 5 hours all three antibiotics have a similar effect, or none.
- Antibiotic A is the least effective: its numbers start to fall last, fall most slowly, peak the highest, never fall as far as with B or C, and are still large at 16 hours.
- Antibiotic B is in the middle: it works better than A but worse than C, starting to reduce numbers after C but before A, and reducing them more and faster than A but more slowly than C.
- Antibiotic C is the most effective: its numbers start to fall first (falling soonest, or fastest, is also credited), peak the lowest, and it is the only one to take the bacteria to zero.
Why it scores
Starting with what is alike makes the comparison clear.
Use words such as most, fastest and lowest, and refer to features of the graph.
Every antibiotic has to be compared with the others to reach the top level.
Giving the size of the difference, such as the highest peak and the numbers left, shows the magnitude.
Revise Antibiotics and Drug ResistanceA crowded culture cannot be counted directly. Ten samples of 0.02 cm3 are taken. Describe how to estimate the bacteria per cm3.
See how you would score on Cell Biology Practical InvestigationsShow model answer for 08.4Hide model answer for 08.4
Dilute each sample so the bacteria are spread out enough to count, then count the bacteria in each sample under a microscope.
Work out the mean count for a single sample of 0.02 cm3.
1 ÷ 0.02 = 50
bacteria per cm3 = mean number in a sample × 50
How the marks are earned
- One mark: dilute each sample, then count the bacteria in it, for example under a microscope.
- One mark: work out the mean count for one sample, then scale up to 1 cm3. Also accepted: the mean × 50, or the total of all ten counts × 5.
Why it scores
First mark: dilute, then count. Counting works only when the cells are not crowded together.
Second mark starts here: the mean of the ten counts reduces the effect of any odd sample.
One cm3 holds 50 samples' worth.
Scaling up gives the estimate.
Revise Cell Biology Practical Investigations