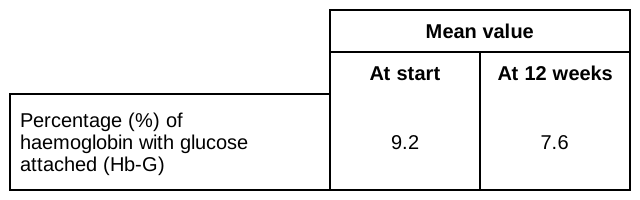
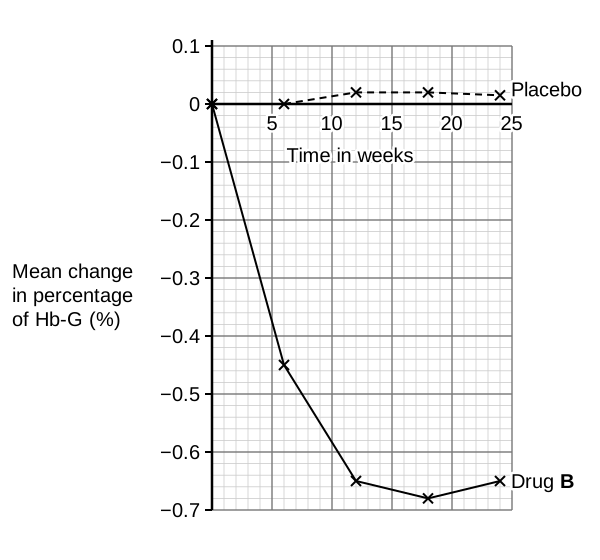
Cases of type 2 diabetes have risen recently. Figure 10 sorts people into three age ranges and, within each, into healthy-weight, overweight and obese groups, giving the percentage affected. Two research teams then trialled drugs for the condition, tracking Hb-G, the share of haemoglobin that has glucose stuck to it, which reflects blood glucose over a long period. People without diabetes have an Hb-G of 4.5% to 6%, and doctors regard a reading under 7% as an acceptable target for patients with type 2 diabetes. Investigation 1 (Table 4): the scientists gave 175 patients a daily injection of drug A, and the course lasted twelve weeks. Investigation 2 (Figure 11): 631 patients took a daily drug B tablet, while a comparison group of 630 took dummy tablets (a placebo); readings were taken at the start and then each six weeks until week 24.
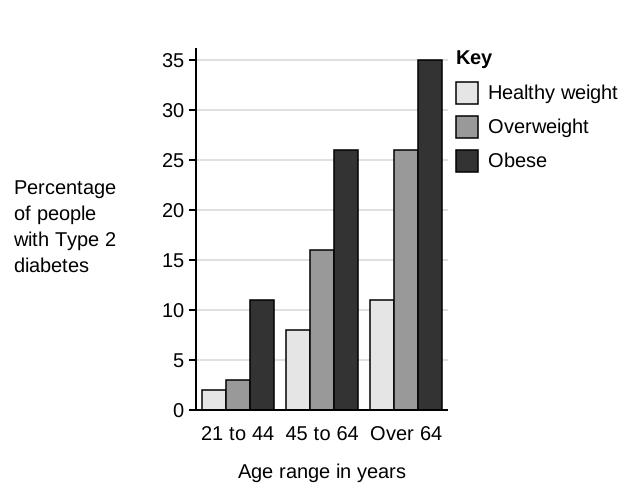
State two conclusions that Figure 10 supports.
Our own questions on this topic, marked straight away, so you see what to revise. Free now.
Show model answer for 09.1Hide model answer for 09.1
1. For healthy-weight, overweight and obese people alike, a greater percentage have type 2 diabetes in each older age range.
2. In each age range, the percentage with type 2 diabetes rises from healthy weight to overweight to obese.
How the marks are earned
- Any two conclusions, one mark each: older age ranges have a larger percentage with type 2 diabetes; heavier body mass or weight goes with a larger percentage of people affected. Naming the share of people affected is not needed: saying diabetes increases with age, or with body mass or weight, is enough.
- The opposite statements are accepted. Statements about the likelihood of having or getting type 2 diabetes are accepted. More older people, or more obese people, having type 2 diabetes is accepted, and so is the percentage rising with obesity.
Why it scores
The bars rise from 21 to 44, to 45 to 64, to over 64, for healthy weight, overweight and obese people alike. This is one mark.
In every age range the obese bar is the tallest and the healthy weight bar the shortest. This is a second mark.
Revise Glucose RegulationDrug B patients started at a mean Hb-G of 8.3%. Use Figure 11 to find the mean Hb-G after 12 weeks. Tick one box.
See how you would score on Glucose RegulationShow model answer for 09.2Hide model answer for 09.2
On the drug B line at 12 weeks the mean change is −0.65. Hb-G after 12 weeks = 8.3 − 0.65 = 7.65 %
How the marks are earned
- Tick 7.65%. The drug B line in Figure 11 shows a mean fall of 0.65 at 12 weeks, so the Hb-G is 8.3 − 0.65 = 7.65.
Why it scores
The graph shows the change from the start, not the Hb-G itself, so take the change away from the starting 8.3. 0.65 is only the change, and 8.95 adds it instead of taking it away.
Revise Glucose RegulationJudge the design of the two trials and how well drug A and drug B help to control type 2 diabetes.
See how you would score on Glucose RegulationShow model answer for 09.3Hide model answer for 09.3
The two trials cannot be compared directly. Drug A was injected into 175 patients for 12 weeks, but drug B was a tablet taken by 631 patients for 24 weeks, and neither dose is stated. Only the drug B trial had a placebo control group, and it had readings every 6 weeks, while Table 4 gives only two readings for drug A.
Both drugs lowered Hb-G. Drug A fell from 9.2% to 7.6%, a fall of 1.6 percentage points. Drug B fell from 8.3% to 7.65% by 12 weeks, a fall of 0.65, and the placebo group stayed almost unchanged.
However, neither drug took Hb-G under 7%, the acceptable limit, so neither fully solves the problem. Drug B's Hb-G was lowest at 18 weeks and had edged up again by 24 weeks, which hints that its effect may fade. Drug A has only two readings, so its trend is unknown, and side effects are not reported for either drug.
Overall, both drugs help to control type 2 diabetes by lowering Hb-G, and drug A lowered it by more, but they started from different values and ended at nearly the same level, above 7%. The evidence is not enough to say which is better. Trials using the same method, dose and time are needed.
How the marks are earned
- This is level marked. The top level, 5 to 6 marks, needs a judgement backed by enough correct reasons that are argued in order, and it must cover both the way the trials were run and how useful each drug is.
- For 3 to 4 marks, some of the reasons link logically, with or without a simple judgement. For 1 to 2 marks, relevant points appear without logical links. Level 1 needs detail on the method or on the usefulness alone; level 3 needs both. No relevant content scores zero. Calling the trials investigation 1 (drug A) and investigation 2 (drug B) is accepted throughout.
- Methods that cannot be compared directly: A is injected and B is a tablet, or A acts more quickly; the doses may differ because none is stated; A ran for 12 weeks and B for 24; only the drug B trial had a placebo control group; only the drug B trial had readings in between, with fewer readings for A; the sample sizes differ, A having 175 patients and B having 631 (1261 counting the placebo group); different scientists carried out each trial; the drug A trial was not double-blind.
- Methods that may be alike: neither trial was double-blind; both gave quantitative measurements; both used a fairly large sample.
- Usefulness (blood glucose is accepted in place of Hb-G): each drug lowers Hb-G, to similar levels; drug A produces the bigger fall; neither takes it under the acceptable 7%; with drug B it climbs again after 18 weeks; nothing is known about side effects for either drug; nothing is known about drug A's trend over time.
Why it scores
This is the methods evaluation: the delivery, time, sample size, control group and number of readings all differ, so the results are not comparable. Level 3 needs method and usefulness both.
This uses figures from Table 4 and Figure 11 to show usefulness. The placebo line shows the fall for drug B was caused by the drug.
These are limits on usefulness: both stay above 7%, drug B levels off, and the missing information is stated.
A judgement that is supported by the reasons above, which is what level 3 asks for. It is cautious because the methods differ.
Revise Glucose Regulation