Figure 1 is a growth chart, a set of percentile curves for the height of boys through childhood. The later parts ask about testing for fat, digesting it and measuring the energy in food.
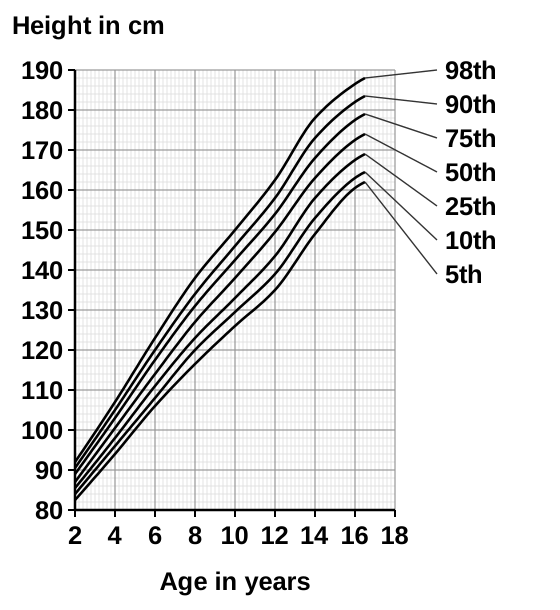
Read Figure 1: how tall is a boy of eight who sits on the 10th percentile curve? Tick one box.
Our own questions on this topic, marked straight away, so you see what to revise. Free now.
Show model answer for 01.1Hide model answer for 01.1
120 cm. Follow the 10th percentile curve to age 8 and read across to the height axis.
How the marks are earned
- Tick 120 cm, the height where the 10th percentile curve meets age 8.
A boy was 94 cm at age 4 and 106 cm at age 6. What does Figure 1 show about his growth?
See how you would score on Cell Biology Practical InvestigationsShow model answer for 01.2Hide model answer for 01.2
His growth is normal and healthy for a boy on his percentile.
His height sits on the 5th percentile curve at age 4 and still on that curve at age 6, so he has not moved up or down.
How the marks are earned
- One mark: his growth is as expected. Healthy growth is credited too.
- One mark: the reason, that he stays on one percentile curve, the 5th, from age 4 to age 6. Quoting the 5th percentile at 6, or just the same percentile, is enough.
- Both marks need one linked idea: growth as expected, because he keeps to the same percentile.
Why it scores
The first mark is for the conclusion about his growth.
The second mark is for the evidence from Figure 1, tied to the conclusion.
Revise Cell Biology Practical InvestigationsHow could you show that a food sample holds fat? Describe a test.
See how you would score on The Human Digestive SystemShow model answer for 01.3Hide model answer for 01.3
Shake a little of the food with ethanol, then pour the liquid into water.
If the water turns white and cloudy, an emulsion has formed, so the food holds fat.
How the marks are earned
- Route one: mix the food with ethanol and water (1 mark); a milky white emulsion forms (1 mark). A cloudy result is credited, and so is calling it the emulsion test.
- Route two, as an alternative: press the food on to paper (1 mark); a grease spot is left (1 mark).
- Either route earns both marks by itself.
Why it scores
Using ethanol and then water earns the first mark. Fat dissolves in ethanol but not in water.
The observed result earns the second mark. It must say what is seen.
Revise The Human Digestive SystemDigesting fat releases which product? Tick one box.
See how you would score on Enzymes in DigestionShow model answer for 01.4Hide model answer for 01.4
Fatty acids. Fats are digested into fatty acids and glycerol. Amino acids come from proteins, and glucose comes from starch.
How the marks are earned
- Tick fatty acids. Lipase digests fats into fatty acids and glycerol.
What quantity does a calorimeter determine?
See how you would score on The Human Digestive SystemShow model answer for 01.5Hide model answer for 01.5
The energy stored in a food. The food is burned and the energy released is measured in joules.
How the marks are earned
- The energy a food contains. Calories or joules both count.
- A temperature or a temperature change on its own earns nothing.