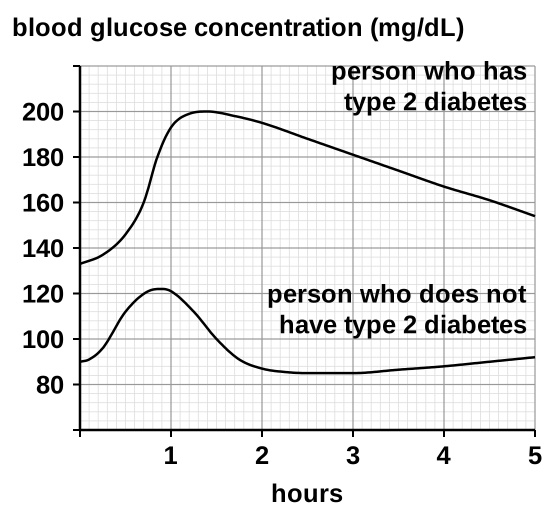
At the menopause, the menstrual cycle comes to an end. Figure 16 is a table of the mean blood levels of three hormones in women, before it and after it. Figure 17 is a graph of blood glucose over 5 hours for two people: one has type 2 diabetes and one does not.
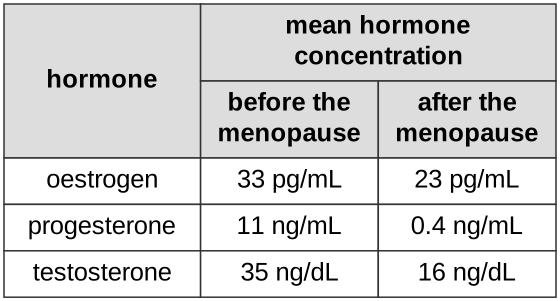
Use Figure 16 to compare and contrast how each hormone level changed once the menopause had happened.
Our own questions on this topic, marked straight away, so you see what to revise. Free now.
Show model answer for 09.1Hide model answer for 09.1
Each of the three hormones falls once the menstrual cycle has stopped.
oestrogen fall = 33 − 23 = 10 pg/mL progesterone fall = 11 − 0.4 = 10.6 ng/mL testosterone fall = 35 − 16 = 19 ng/dL
The size of the fall differs. Progesterone drops by about 96%, almost to nothing, testosterone by about 54%, and oestrogen by only about 30%.
How the marks are earned
- Any three from the four below. One mark each.
- Every one of the three hormones is lower after the menopause.
- Oestrogen fell by 10 pg/mL. A fall of 30% is accepted.
- Progesterone fell by 10.6 ng/mL. A fall of 96% is accepted.
- Testosterone fell by 19 ng/dL. A fall of 54% is accepted.
Why it scores
The shared pattern earns the first mark.
Each fall worked out from Figure 16 earns a mark. Three points in all earn full marks.
This is the contrast. Percentage falls are accepted in place of the actual falls.
Revise Hormones & BehaviourExplain what FSH and what LH each do during the menstrual cycle.
See how you would score on Hormones & BehaviourShow model answer for 09.2Hide model answer for 09.2
FSH, from the pituitary gland, makes a follicle in the ovary develop, so that an egg matures inside it.
FSH also makes the ovaries release oestrogen.
LH causes ovulation: around day 14 a surge of LH makes the mature egg leave the ovary.
How the marks are earned
- Any three from the five below, each linked to the right hormone. One mark each.
- FSH makes a follicle develop (the word mature is not needed).
- FSH makes an egg (ovum) mature. Egg is accepted for ovum.
- FSH makes the ovary produce oestrogen.
- LH causes ovulation. The egg being released is accepted.
- LH linked to the corpus luteum. For example, the corpus luteum forming from the empty follicle, but that detail is not required.
Why it scores
The follicle and the egg maturing are both FSH points.
Oestrogen production is another FSH point.
Ovulation, or the egg being released, is the LH point. Any three points earn full marks.
Revise Hormones & BehaviourUsing data from Figure 17, explain how blood glucose is kept in check in someone with type 2 diabetes and in someone without it.
See how you would score on Glucose RegulationShow model answer for 09.3Hide model answer for 09.3
In the person without diabetes, blood glucose starts at about 90 mg/dL and rises to a peak of about 122 mg/dL after about 1 hour, as glucose from food is absorbed. The pancreas detects the rise and releases insulin.
Insulin makes body cells take in glucose, and the liver converts glucose into glycogen and stores it. So by about 2 hours the level is back down to about 87 mg/dL. Its lowest is about 85 mg/dL, and it stays between about 85 and 92 mg/dL for the rest of the time.
If blood glucose falls too low, the pancreas releases glucagon instead. Glucagon makes the liver turn glycogen back into glucose, which raises the blood glucose level again. The two hormones together keep the level in a narrow range.
In type 2 diabetes the body cells no longer respond properly to insulin, so glucose is not taken out of the blood quickly. The diabetic's curve starts higher, at about 133 mg/dL, rises more steeply to about 200 mg/dL at about 1.4 hours, and falls slowly, still about 154 mg/dL after 5 hours. It never comes down into the healthy range.
Type 2 diabetes is controlled by a diet low in sugar and carbohydrate and by regular exercise. If this is not enough, the person takes medicine, and some inject insulin, to bring their blood glucose down.
How the marks are earned
- Level marked. Level 3 (5 to 6 marks): a detailed, fully developed account of glucose control for both people, giving the job of insulin or glucagon, tied to glucose values from Figure 17, and naming both insulin and glucagon. Clear, logical order throughout.
- Level 2 (3 to 4 marks): a brief account of control in the person without diabetes, or in the type 2 diabetic, or a remark on each, linked to data from the graph.
- Level 1 (1 to 2 marks): a short remark on glucose control in either person, or one valid point from the graph. Two graph points, or one control point with one graph point, reach the top of the level.
- Control without diabetes: both insulin and glucagon act; insulin is released by the pancreas and lowers blood glucose by turning glucose into glycogen, which the liver stores; glucagon is released by the pancreas and raises blood glucose by turning glycogen back into glucose.
- Type 2 diabetes: the body cells resist insulin, so blood glucose stays high; it is managed by diet and exercise, by medicine, or by injecting insulin to bring glucose down.
- Graph points: the top curve sits above the bottom one at every time, spanning 135 up to 200 mg/dL, while the bottom curve spans 90 up to 125 mg/dL; the top curve climbs more steeply and falls more slowly. Close readings, such as 133 to 200 and 85 to 122 mg/dL, are credited.
Why it scores
This ties the healthy curve in Figure 17 to the release of insulin from the pancreas.
How insulin lowers glucose, with data from the graph, is detail needed for the top level.
Level 3 needs both insulin and glucagon.
This explains the type 2 curve and links it to values read from Figure 17: higher throughout, a steeper rise and a slower fall.
How type 2 is controlled completes a detailed account for both people, which earns 6 of 6.
Revise Glucose Regulation