Test yourself on Graphical Solutions with exam style questions, marked instantly.
Flashcards that come back just before you would forget them.
A revision plan that remembers what you know and shows what to do next.
See which topics you have nailed and which need another look.
Quiz yourself on Graphical SolutionsGet your flashcardsBuild my revision planTrack my progressWhere Algebra Meets Graphs
Visual: Different Types of Graphical Solutions
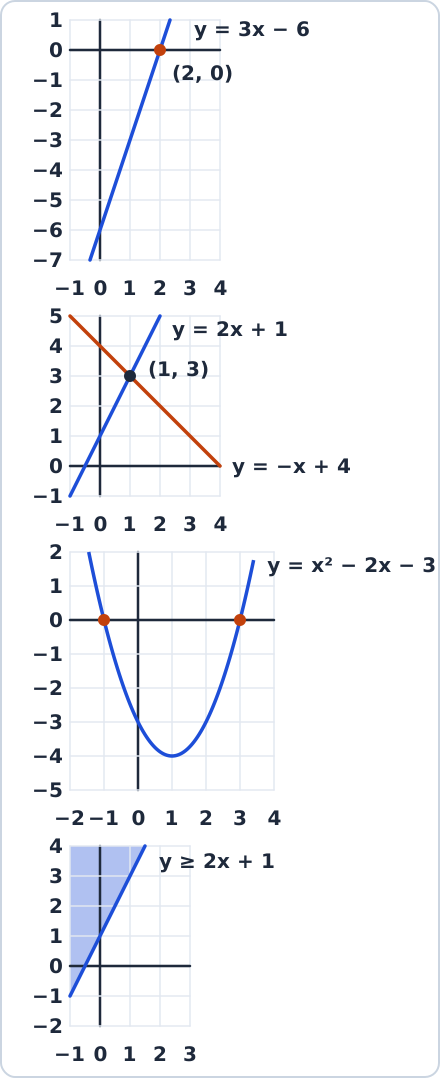
Top to bottom: the line y = 3x − 6 meets the x-axis, two lines meet, the curve meets the x-axis at −1 and 3, and a region is shaded.
What Can We Solve Graphically?
| Equation Type | Graph Intersection | Solution Method |
|---|---|---|
| Linear Equation 3x - 6 = 0 |
Line crosses x-axis | Find x-intercept |
| Simultaneous Linear y = 2x + 1 y = -x + 4 |
Two lines intersect | Find crossing point coordinates |
| Quadratic Equation x² - 2x - 3 = 0 |
Parabola crosses x-axis | Find x-intercepts (roots) |
| Inequalities (Higher tier) y ≥ 2x + 1 |
Region above/below line | Identify solution region |
Method 1: Solving Linear Equations Graphically
- Rearrange equation to y = mx + c form
- Plot the line using gradient and y-intercept
- Find x-intercept (where line crosses x-axis, y = 0)
- Read coordinates carefully from the graph
- Check by substituting back into original equation
Worked Example 1: Linear Equation
Solve graphically: 3x - 6 = 0
Step 1 Rearrange to standard form
3x - 6 = 0
3x = 6
y = 3x - 6 (set LHS equal to y)
Step 2 Identify line properties
Gradient (m) = 3
y-intercept = -6
Line passes through (0, -6) and (2, 0)
Step 3 Find x-intercept
Where line crosses x-axis: y = 0
0 = 3x - 6
6 = 3x
x = 2
Step 4 Check solution
3(2) - 6 = 6 - 6 = 0 ✓
Method 2: Solving Simultaneous Equations Graphically
- Plot both lines on the same axes
- Find intersection point where lines cross
- Read coordinates (x, y) of intersection
- Check solution in both original equations
- Consider special cases: parallel lines (no solution), same line (infinite solutions)
Worked Example 2: Simultaneous Linear Equations
Solve graphically: y = 2x + 1 and y = -x + 4
Step 1 Plot first line: y = 2x + 1
y-intercept: (0, 1)
Gradient: 2 (up 2, right 1)
Another point: (1, 3)
Step 2 Plot second line: y = -x + 4
y-intercept: (0, 4)
Gradient: -1 (down 1, right 1)
Another point: (1, 3)
Step 3 Find intersection
Lines cross at point (1, 3)
Solution: x = 1, y = 3
Step 4 Check both equations
First: y = 2(1) + 1 = 3 ✓
Second: y = -(1) + 4 = 3 ✓
Method 3: Solving Quadratic Equations Graphically
- Rearrange to standard form: ax² + bx + c = 0
- Plot parabola y = ax² + bx + c
- Find x-intercepts where parabola crosses x-axis (y = 0)
- Read x-coordinates of intersection points
- Consider cases: 2 roots, 1 root (tangent), or no real roots
Worked Example 3: Quadratic Equation
Solve graphically: x² - 2x - 3 = 0
Step 1 Set up parabola equation
y = x² - 2x - 3
This is a U-shaped parabola (a > 0)
Step 2 Find key points
y-intercept: (0, -3)
Vertex: x = -b/2a = -(-2)/2(1) = 1
At x = 1: y = 1 - 2 - 3 = -4
Vertex: (1, -4)
Step 3 Plot and find x-intercepts
Parabola crosses x-axis at two points
Reading from graph: x = -1 and x = 3
Solutions: x = -1 or x = 3
Step 4 Verify solutions
x = -1: (-1)² - 2(-1) - 3 = 1 + 2 - 3 = 0 ✓
x = 3: (3)² - 2(3) - 3 = 9 - 6 - 3 = 0 ✓
Method 4: Solving Inequalities Graphically (Higher tier)
- Plot boundary line (solid if ≤ or ≥, dashed if < or >)
- Choose test point not on the line (often use origin if convenient)
- Substitute coordinates into inequality
- Shade correct region: if test point satisfies inequality, shade that side
- Check solution by testing another point in shaded region
Worked Example 4: Linear Inequality (Higher tier)
Solve graphically: y ≥ 2x + 1
Step 1 Plot boundary line
y = 2x + 1 (solid line since ≥)
y-intercept: (0, 1)
Gradient: 2
Step 2 Test a point
Use origin (0, 0): Is 0 ≥ 2(0) + 1?
Is 0 ≥ 1? No ✗
So shade the side of the line that does not contain the origin
Step 3 Identify solution
Shade region above and including the line
Solution: All points on or above y = 2x + 1
Reading Solutions from Graphs
Real-World Applications
Worked Example 5: Real-World Problem
Plan A: £20 monthly + £0.10 per minute
Plan B: £35 monthly + £0.05 per minute
When do the plans cost the same?
Step 1 Set up equations
Let x = minutes used, y = total cost
Plan A: y = 20 + 0.1x
Plan B: y = 35 + 0.05x
Step 2 Plot both lines
Plan A: starts at (0, 20), gradient 0.1
Plan B: starts at (0, 35), gradient 0.05
Lines will intersect (Plan A rises faster)
Step 3 Find intersection
20 + 0.1x = 35 + 0.05x
0.05x = 15
x = 300 minutes
Plans cost same at 300 minutes (£50)
Step 4 Interpret solution
Below 300 mins: Plan A cheaper
Above 300 mins: Plan B cheaper
At exactly 300 mins: Both cost £50
Advanced: Graphical Solution Accuracy
Make this stick
Signing in gives access to all PrepWise features.