Test yourself on Images & Sound with exam style questions, marked instantly.
Flashcards that come back just before you would forget them.
A revision plan that remembers what you know and shows what to do next.
See which topics you have nailed and which need another look.
Quiz yourself on Images & SoundGet your flashcardsBuild my revision planTrack my progressImage and Sound Data Representation
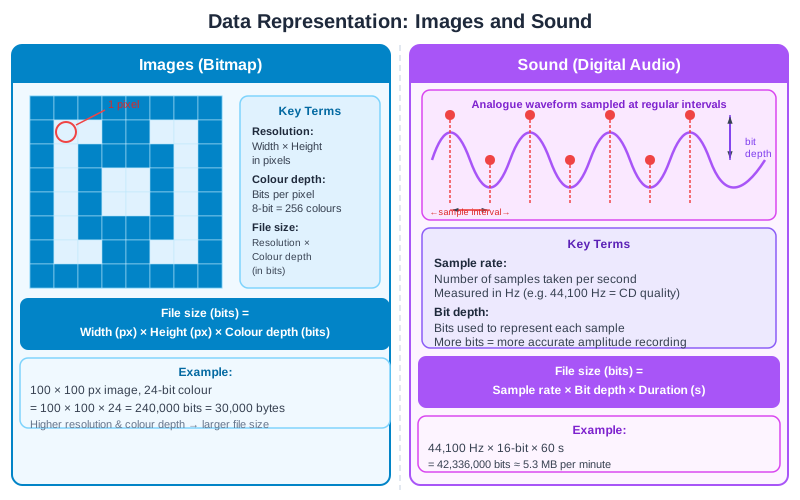
Image: the grid is the resolution (width × height) and each pixel stores its colour in a number of bits, called the colour depth. This grid has two colours, so each pixel needs 1 bit. Image file size (bits) = width × height × colour depth. Sound: the time between samples is set by the sample rate, the number of samples taken each second (Hz); Edexcel calls the gap the sample interval. Bit depth is the number of bits used for each sample (AQA calls it sample resolution). Sound file size (bits) = sample rate × bit depth × duration. For stereo sound, an extra step is to multiply by 2 channels.
Make this stick
Signing in gives access to all PrepWise features.